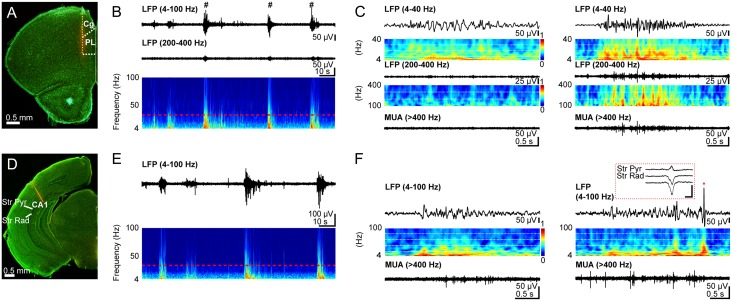
Figure 4.
Patterns of oscillatory activity in PL and hippocampal CA1 area of neonatal control mice. (A) Digital photomontage reconstructing the location of the DiI-labeled recording electrode (orange) in PFC of a Nissl-stained 75-µm-thick coronal section from a P10 mouse. The superimposed yellow dots mark the 16 recording sites covering the prefrontal subdivisions, cingulate cortex (Cg) and PL. (B) Extracellular LFP recording of discontinuous oscillatory activity in PL from a P10 mouse displayed after band-pass (4–100 Hz, 200–400 Hz) filtering. Traces are accompanied by the color-coded wavelet spectra of the LFP at identical time scale. The red-dotted line indicates the lower border of the gamma frequency range (30 Hz). NG characterized by a wide frequency distribution and superimposed HFOs (200–400 Hz) are marked by hashes. (C) Left: Characteristic SB displayed after band-pass (4–40 Hz and 200–400 Hz) filtering and the corresponding MUA after 400 Hz high-pass filtering. Color-coded frequency plots show the wavelet spectra at identical time scale. Right: Characteristic NG displayed after band-pass (4–40 Hz and 200–400 Hz) filtering and the corresponding MUA after 400 Hz high-pass filtering. Color-coded frequency plots show the wavelet spectra at identical time scale. Note the presence of prominent beta-low gamma episodes with nested HFOs that are accompanied by strong spike discharge. (D) Same as (A) for recording electrode in hippocampal CA1. The superimposed yellow dots mark the 16 recording sites covering stratum pyramidale (Str Pyr) and radiatum (Str Rad). (E) Same as (B) for hippocampal LFP. (F) Left: Characteristic theta burst displayed after band-pass (4–100 Hz) filtering accompanied by the corresponding MUA after 400 Hz high-pass filtering and the color-coded frequency plot at identical time scale. Right: Characteristic theta burst with sharp wave (red asterisk) displayed after band-pass (4–100 Hz) filtering accompanied by the corresponding MUA after 400 Hz high-pass filtering and the color-coded frequency plot at identical time scale. Inset, sharp wave reversing between Str Pyr and Str Rad and displayed at a larger time scale. Scale bars for inset correspond to 200 µV and 0.1 s.

