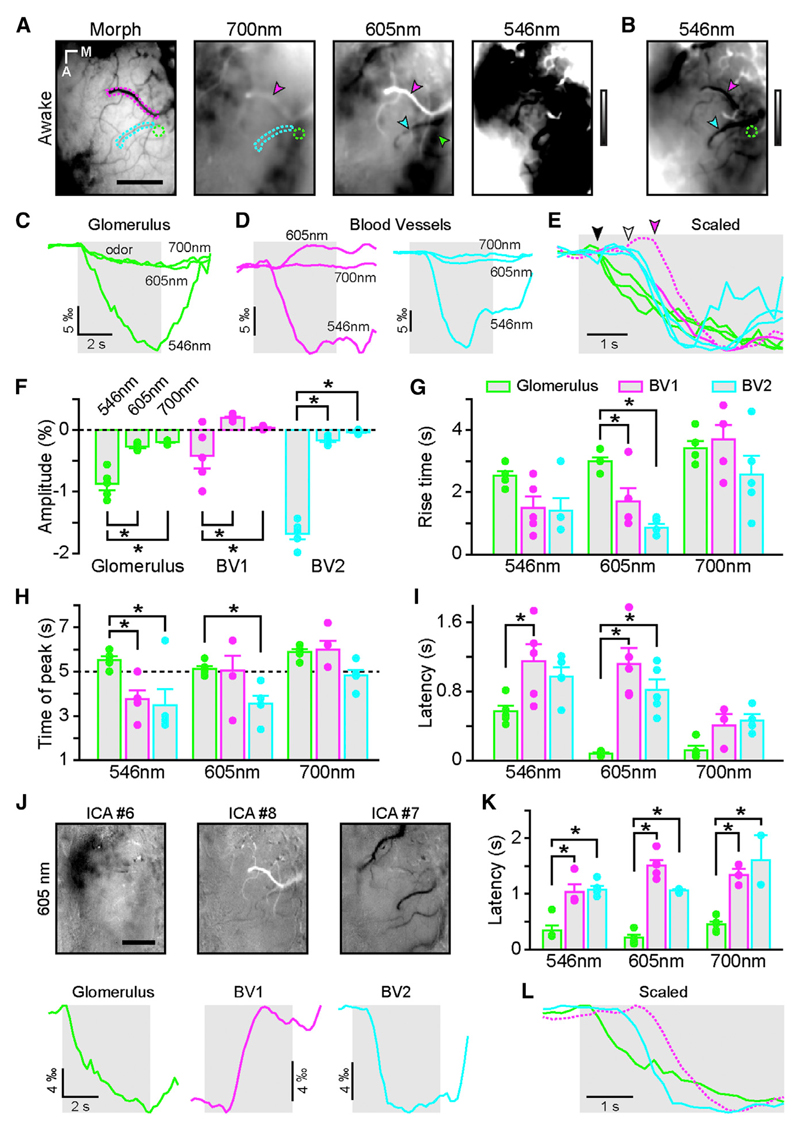
Figure 1. Odor-Evoked Glomerular and Vascular Intrinsic Optical Signals Have Different Kinetics in Awake Mice.
(A) Blood vessel pattern of the dorsal OB (Morph) and IOS glomerular map evoked by ethyl butyrate (5% in air) recorded at three different wavelengths in the same animal (gray look-up table [LUT]: −0.005 to 0.005 ΔR/R). Green and cyan/magenta dotted lines and arrowheads indicate regions of interest (ROIs) placed over an activated glomerulus and blood vessels, respectively.
(B) Rightmost image shown in (A) (546 nm) after adjusting the look-up table (−0.02 to 0.02 ΔR/R).
(C) IOS time course of the glomerulus marked in (A) and (B) (green ROI and arrow) at the different wavelengths.
(D) IOS time course of the blood vessels marked in (A) and (B) (magenta and cyan ROIs and arrowheads) at the different wavelengths. Note the positive IOSs in the blood vessel marked in magenta at 605 nm.
(E) IOS traces shown in (C) and (D) but scaled for comparison. The magenta dotted line has been flipped for better comparison. Note the delay from odor onset of the blood vessel response (white and magenta arrowheads) compared to glomerular ones (black arrowhead).
(F) Average amplitude of IOSs recorded in glomeruli (green) and in blood vessels (magenta and cyan). Note the difference in amplitude between the two groups of blood vessels, particularly at 605 nm.
(G) Average rise time measured between 20% and 80% of the response amplitude in glomeruli (green) and in blood vessels (magenta and cyan). Two-way ANOVA with repeated-measures F(2, 12) = 7.67; p = 0.007 for the ROI effect with Tukey’s correction for post hoc multiple comparison analysis.
(H) Time of the peak of the IOS responses in glomeruli (green) and in blood vessels (magenta and cyan) relative to odor onset. The dashed line at 5 s represents the end of the odor application. Two-way ANOVA with repeated-measures F(2, 12) = 10.6; p = 0.002 for the ROI effect with Tukey’s correction for post hoc multiple comparison analysis.
(I) Latency from odor onset of the IOS responses in glomeruli (green) and in blood vessels (magenta and cyan). Two-way ANOVA without repeated-measures F(2, 33) = 13.2; p < 10−4 for the ROI effect with Tukey’s correction for post hoc multiple comparison analysis.
(J) Independent component analysis on the raw ΔR/R time series extract glomerular signal (ICA no. 6), positive signals in blood vessels (ICA no. 8), and negative signals in blood vessels (ICA no. 7) at 605 nm. The same recording presented in (A)–(E) was used here. The temporal profiles extracted by the ICA are presented at the bottom whereas Z score maps are presented above. Note that the antero-medial and the postero-lateral clusters of glomeruli are often separated by the ICA (compare A and J).
(K) Latency from odor onset of the IOS responses in glomeruli (green) and in blood vessels (magenta and cyan) calculated from the ICA waveforms. Two-way ANOVA without repeated-measures F(2, 30) = 92.6; p < 10−4 for the ROI effect with Tukey’s correction for post hoc multiple comparison analysis.
(L) ICA waveforms shown in (J) scaled for comparison. The magenta dotted line has been flipped for better comparison. Note the delay from odor onset of the blood vessel response (cyan and especially magenta) compared to glomerular ones.
The scale bars represent 400 µm in (A) and (J). The light gray boxes represent odor application. * indicates corrected post hoc test p < 0.05. For clarity, significant comparisons are only indicated between wavelength (in F) or between ROI types (in G–K). Data are presented as mean ± SEM. See also Figure S1.

