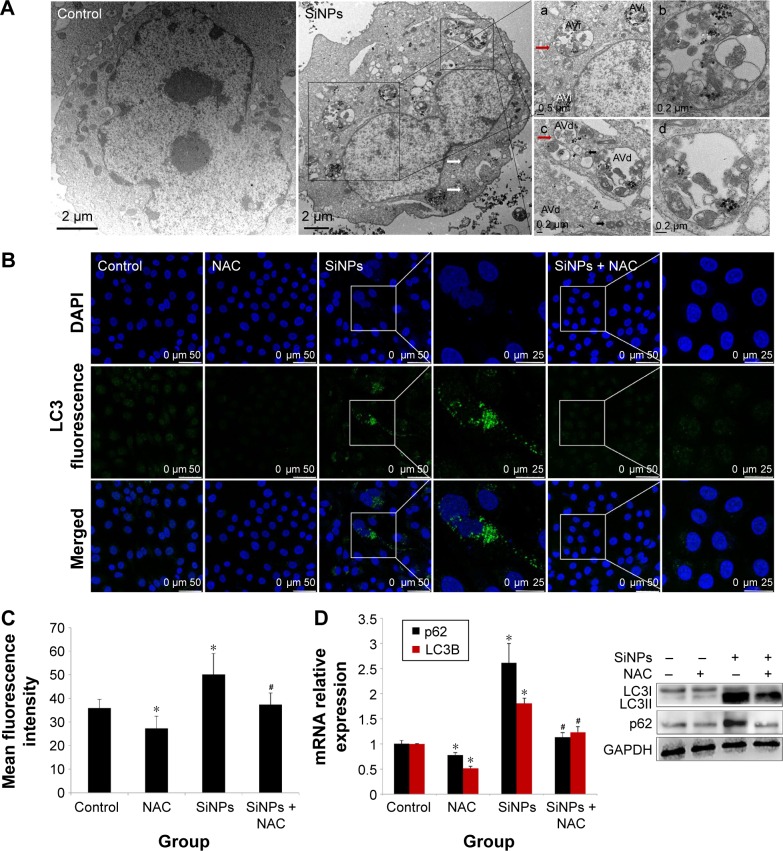
Figure 8.
Induction of autophagy by SiNPs and reversed by NAC.
Notes: (A) Induction of autophagy in HUVECs by 50 μg/mL SiNPs observed under TEM. Control shows typical distribution of organelles within vascular endothelial cells. SiNPs-treated cell shows appearance of numerous perinuclear vacuoles typical of an autophagic cell. The white and black arrows indicate damaged mitochondrial and impaired lysosome, respectively, whereas the red arrow indicates a double-membranous phagophore developing into an autophagosome; (a and b) early autophagic vacuoles (AVi) containing membrane-bound cytoplasmic material, (c and d) and late autophagic vacuoles (AVs) with partially degraded cytoplasmic materials. LC3B expression was determined by immunofluorescence. Images demonstrate enhanced LC3-positive dots in HUVECs under 50 μg/mL SiNPs exposure, (B and C) while NAC pretreatment reversed the elevated LC3 level to nearly normal state. (D) Quantification of LC3 and p62 expressions was done by quantitative real-time PCR at mRNA level, and by Western blot at corresponding protein level. Data represented are the mean ± SD from three independent experiments. *P<0.05 vs control; #P<0.05 for SiNPs vs SiNPs + NAC.
Abbreviations: SiNPs, silica nanoparticles; NAC, N-acetylcysteine; HUVECs, human umbilical vein endothelial cells; TEM, transmission electron microscopy; PCR, polymerase chain reaction; SD, standard deviation; DAPI, 4′,6-diamidino-2-phenylindole.

