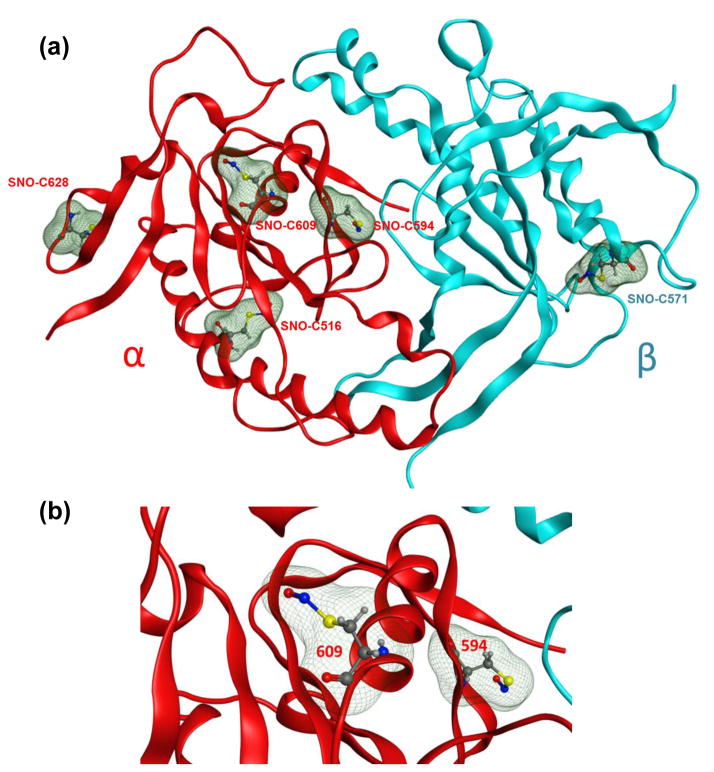
Fig. 4. Model of the S-nitrosated catalytic domain of rat sGC.
(a) α subunit of rat sGC is shown as red ribbons and β subunit is as light blue ribbons. S-nitrosated Cys residues are depicted as balls-and-sticks with their molecular volumes added as green mesh surfaces for visual purpose. The structure presented here is an averaged structure obtained after 20 ns of MD simulation. (b) A close-up of S-nitrosated cysteine 609 and 594. The color scheme is the same as in (a).

