
Figure 2.
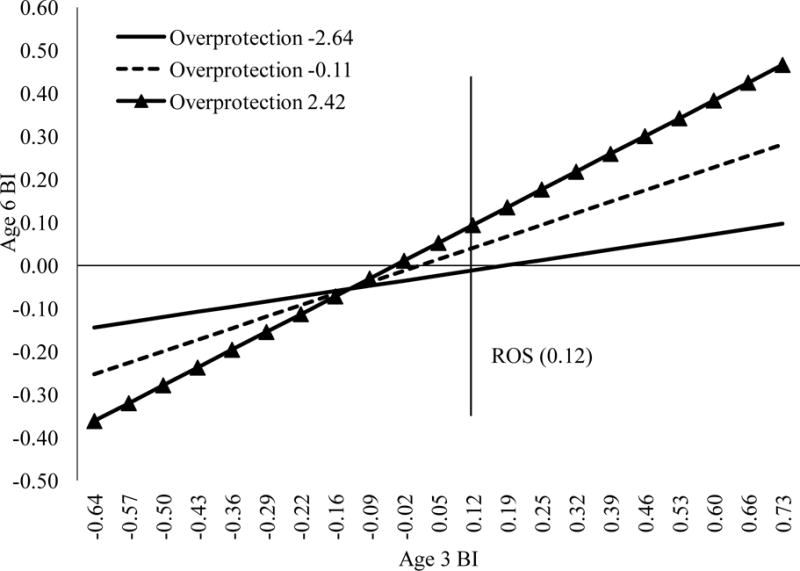
Interaction between age 3 BI and parent-reported overprotection predicting age 6 BI. The value x = 0.12, derived using the Johnson-Neyman technique (Johnson & Fay, 1950), indicates the value of age 3 BI above which significant differences in age 6 BI emerge for children exposed to varying levels of parental overprotection. Simple slopes use the mean value of parent-reported overprotection, as well as values one standard deviation above and below the mean. Age 3 BI, age 6 BI, and parent-reported overprotection are mean-centred. ROS = region of significance.