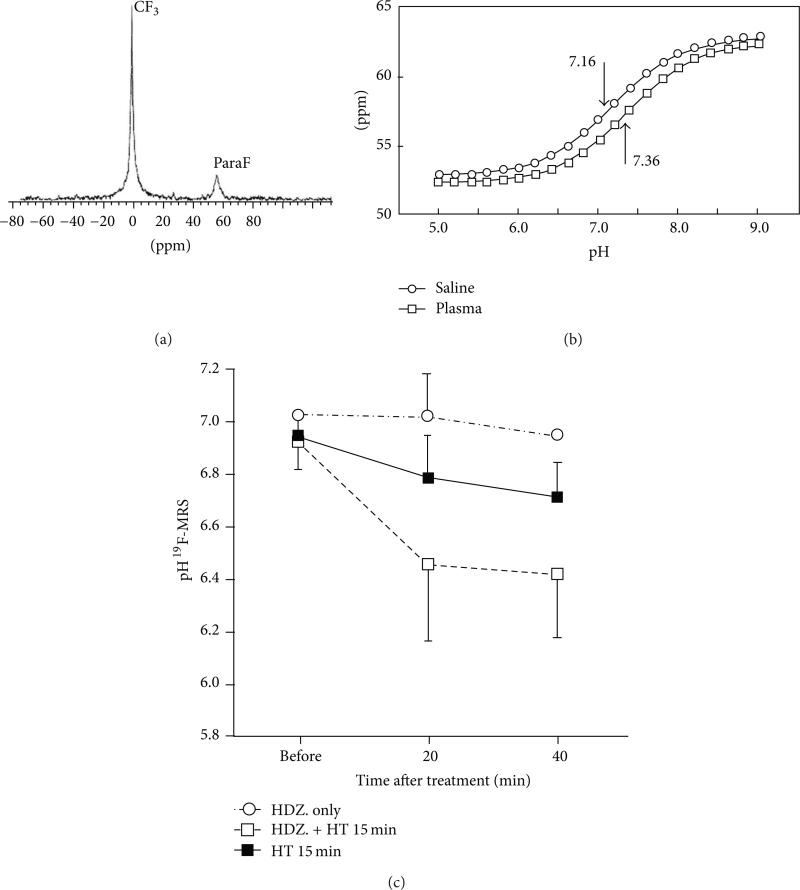
Figure 10.
19F MR spectroscopy of tumor pHe. (a) The 19F MR spectrum of ZK-150471 shows two peaks. (b) The chemical shift difference of these two peaks is correlated with pH. (c) The average pHe measured with 19F MRS showed a decrease after heating with and without 5 mg/kg hydralazine. Reproduced with permission from [42].

