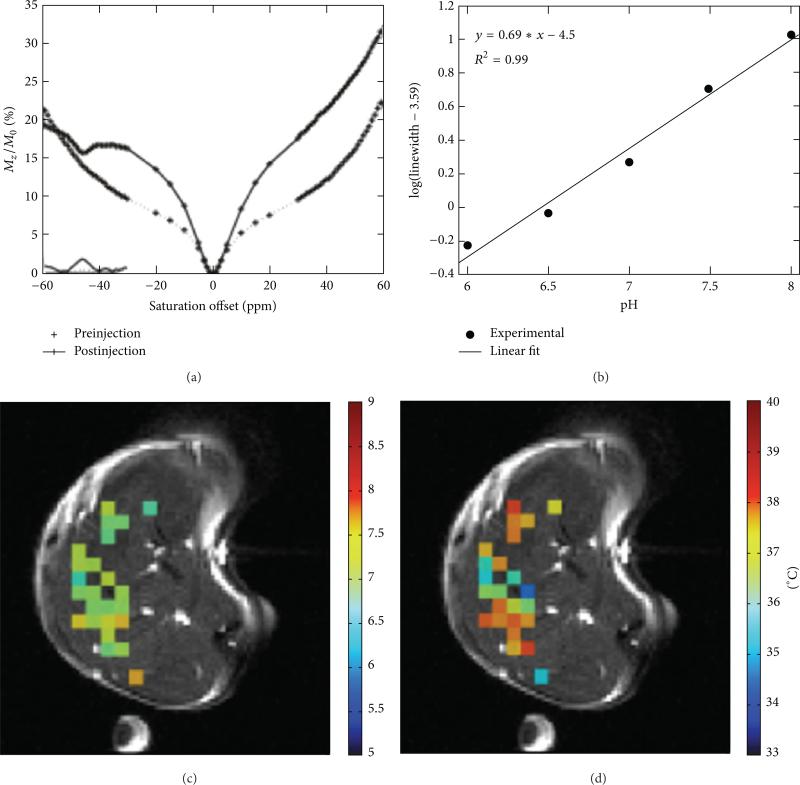
Figure 17.
CEST MRI of leg pHe with Tm-DOTAM-Gly-Lys. (a) An in vivo CEST spectrum of the tumor mass before and after direct injection of the agent into the left mouse leg. (b) The linewidth of the CEST effect is calibrated with pH. (c) The in vivo pHe map and (d) the in vivo temperature map are superimposed onto a preinjection anatomical image. The temperature is determined from the chemical shift of the CEST effect. Reproduced with permission from [62, 63].

