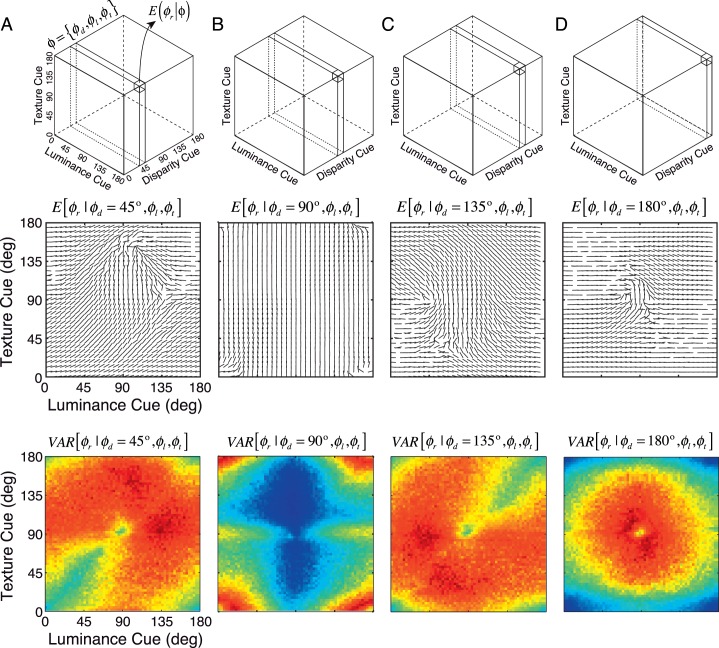
Figure 9.
Three cue optimal estimates and precision, for all values of luminance and texture when A disparity equals 45°, B disparity equals 90°, C disparity equals 135°, and D disparity equals 180°. Top row: The cue cube indicates the plane from which the optimal estimates are shown. Middle row: Line segment orientation indicates the tilt estimate given each particular combination of cue values. Bottom row: Circular variance of optimal estimates. The color bar is the same as in Figure 8D (i.e., circular variance on [0.1 1.0]).

