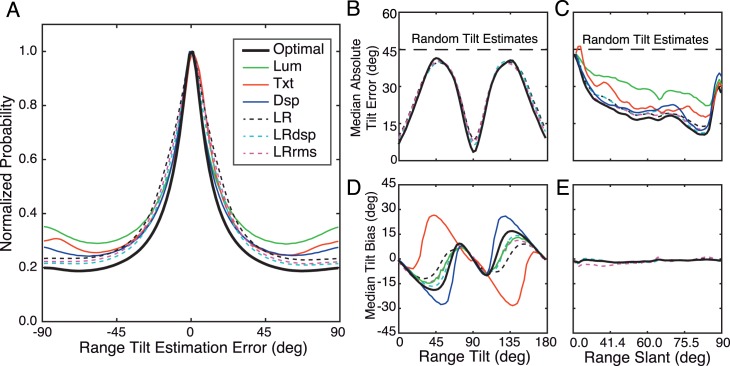
Figure 12.
Comparison of the optimal conditional-means method and other estimators. (A) Grand histogram of errors for the optimal (black), luminance gradient cue only (green), texture gradient cue only (red), disparity gradient cue only (blue), linear reliability–based cue combination (dashed black), linear reliability–based cue combination with local disparity-specified distance as the auxiliary cue (dashed cyan), and linear reliability–based cue combination with local RMS contrast as the auxiliary cue (dashed cyan). (B) Mean absolute error as a function of ground-truth tilt. (C) Mean absolute error as a function of range slant (cf. Figure 6F). (D) Median tilt bias as a function of range tilt. (E) Median tilt bias as a function of range slant. To reduce clutter, the single-cue results are not shown in B and E.

