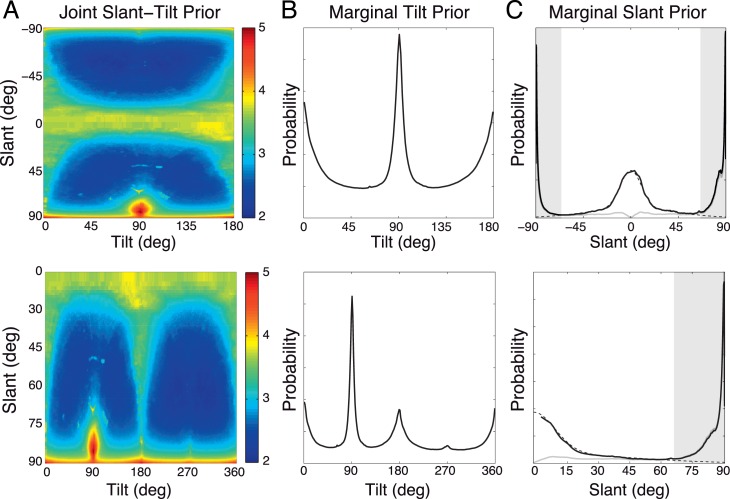
Figure 15.
Slant-tilt prior in natural scenes, for two equivalent parameterizations of slant and tilt. Upper row: tilt = [0 180), slant = [−90 90); lower row: tilt = [0 360), slant = [0 90). A joint prior distribution of slant-tilt in natural scenes. The color bar indicates the count in log10 (e.g., 5 indicates a count of 105); some slant-tilt combinations are ∼100× more likely than others. High slants at tilt = 90° (e.g., ground plane straight ahead) are most probable. Slant zero surfaces are also quite probable (where tilt is undefined). (B) The marginal tilt prior distribution. (The upper plot is exactly the same data as Figure 7B). (C) The marginal slant prior distribution. The dashed black curve is a mixture of Gaussians fit to the slant prior (see Appendix for parameters). The gray curve is the marginal slant distribution computed without an area-preserving projection. The shaded areas (|slant| > 67.5°) indicate results that may be due to depth discontinuities rather than the surfaces of individual objects.

