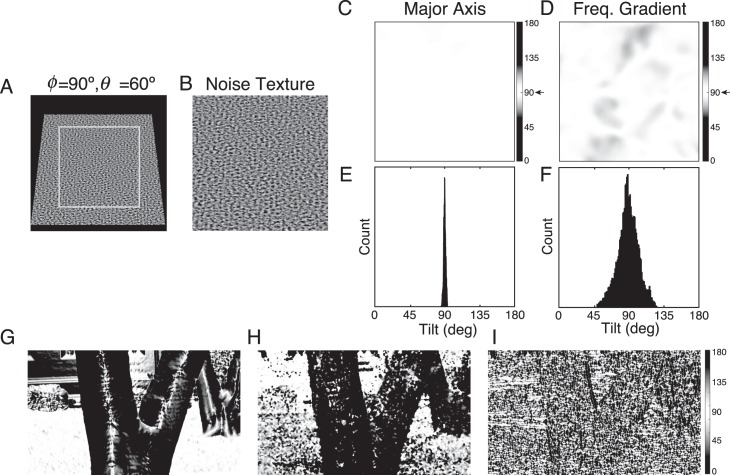
Figure 16.
Comparison of texture cues for tilt estimation. (A, B) Synthesized image of a planar textured surface with a slant of 60° and a tilt of 90°. (C) Map of the tilt estimated at each pixel location in B for the major axis cue used here. The map is all white because the major axis of the spectrum is 90° at all locations. (D) Map of the tilt estimated at each pixel location in B for the frequency centroid gradient cue. (E, F) Histograms of the tilt estimates for the two cues. (G) Map of ground-truth tilt at each pixel location of an example natural image. (H) Map of estimated tilts for example natural image using major axis cue. (I) Map of estimated tilts for example image using frequency centroid gradient cue.

