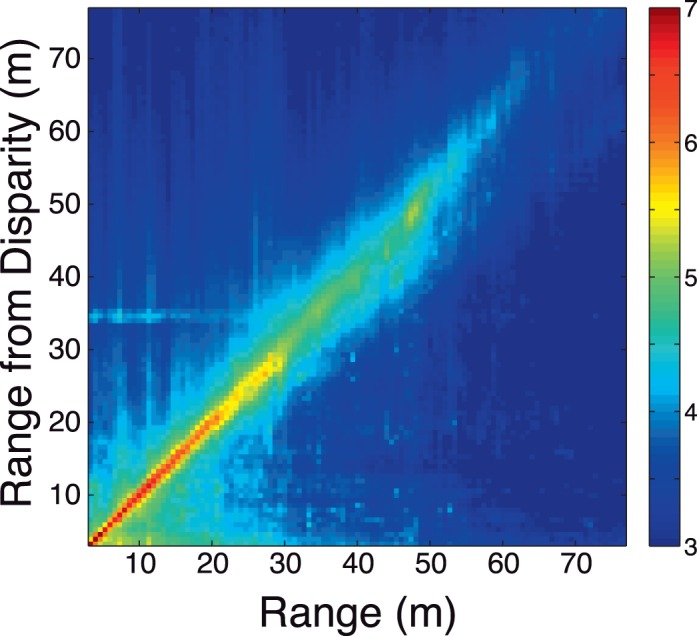
Figure A2.

Range estimates from disparity. (A) Histogram of range from disparity estimates against ground-truth range. The color bar indicates the log-base-10 number of samples in each bin. The fact that nearly all the samples are on the positive oblique indicates that the disparity estimation routine (Equation A7) is largely accurate. (B) Mean (solid black curve) and median (black dashed curve) range estimates from disparity as a function of distance. Error bars show 68% confidence intervals of the mean.
