
Figure 2.
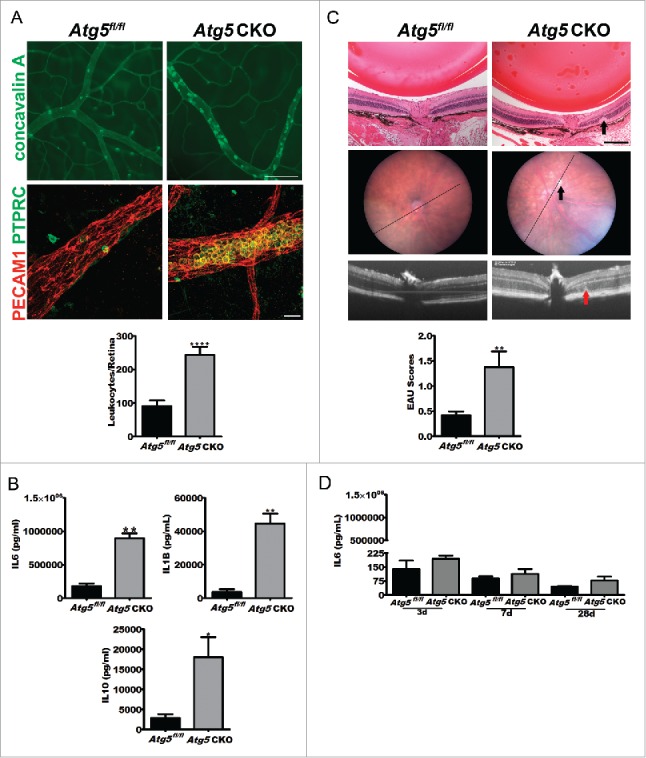
Atg5 CKO mice develop severe uveitis and undergo a cytokine storm. (A) Representative concavalin A lectin perfused (top; scale bar: 100 µm) or PECAM1 (platelet/endothelial cell adhesion molecule 1) and PTPRC (protein tyrosine phosphatase, receptor type, C) costained (bottom; scale bar: 20 µm) retinal vasculature whole mount images from Atg5fl/fl control (n = 10) or Atg5 CKO (n = 10) conditional knockout mice 24 h postuveitis initiation by 10 mg/kg bacterial LPS and quantification of retinal leukostasis (graph). Student t test ****, P < 0.0001. (B) IL6, IL1B, and IL10 serum levels in Atg5 CKO (n = 3 mice) and control mice (n = 3) 6 h postLPS treatment. Student t test *, P < 0.05; **, P < 0.01. (C) Representative histology from Atg5fl/fl control (n = 19) or Atg5 CKO (n = 17) conditional knockout mice treated with 200 µg RBP31-20 to induce EAU (top; scale bar: 200 µm) with corresponding fundus (top) and OCT imaging (middle), and EAU grading (bottom). The black line in the eye fundus photo indicates the area used for the OCT image below. Arrows in Atg5 CKO images indicate an area of intra-retinal abnormality that was observed across histology, fundus imaging and OCT imaging. Mann-Whitney U-test *, P < 0.05 (D) IL6 serum levels 3, 7 or 28 d postRBP31-20 inoculation to initiate EAU in Atg5 CKO (n = 5) or floxed control (n = 4) mice. All data are represented as mean ± SEM.