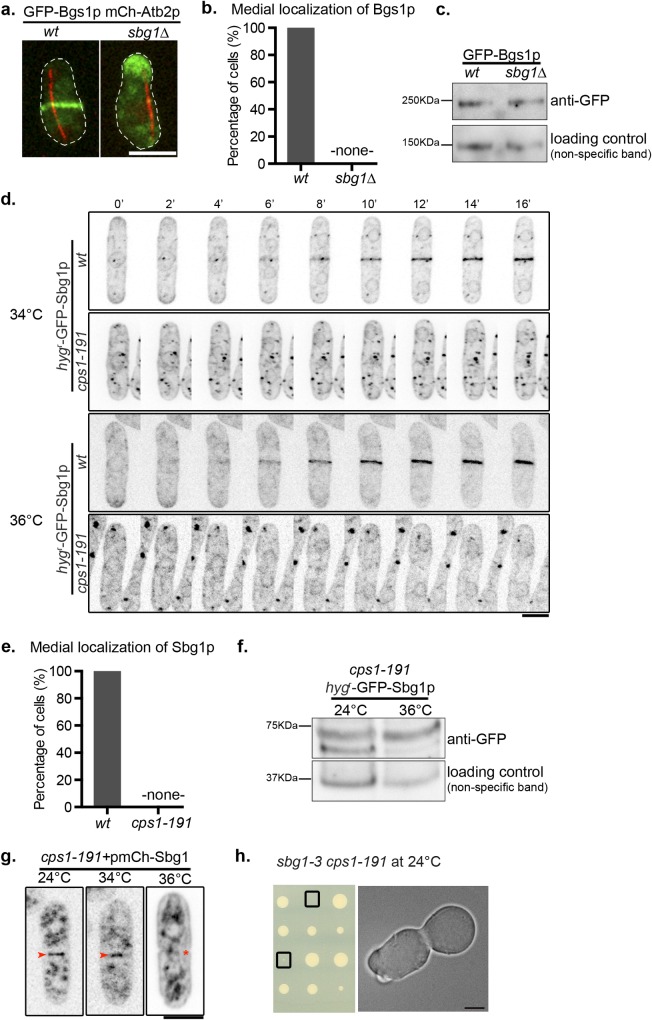
Fig 6. Localization dependencies between Sbg1p and Bgs1p.
(A) Maximum Z projection spinning disk confocal images of germinated cells of the indicated genotype from diploid sbg1Δ/sbg1+ mCherry-Atb2p GFP-Bgs1p (MBY9160). Green, GFP-Bgs1p. Red, mCherry-Atb2p. (B) Quantification for the experiment described in (a). (C) Determination of Bgs1p protein levels in wild type cells (GFP-Bgs1p MBY8865) and sporulated sbg1Δcells from diploid sbg1Δ/sbg1+ GFP-Bgs1p (MBY11106) respectively. (D) Time-lapse maximum Z projection spinning disk confocal montage of the indicated strains: hygr-GFP-Sbg1p (MBY8967) and cps1-191 hygr-GFP-Sbg1p (MBY9097) after 3 hr at 34°C and 36°C. Images are inverted for Sbg1p fluorescence. (E) Quantification for the experiment described in (d). (F) Determination of Sbg1p protein levels in cps1-191 hygr-GFP-Sbg1p (MBY9097) cells at 24°C and 36°C after 4 hr. (G) Maximum Z projection spinning disk confocal images of cps1-191 cells carrying multi-copy expression plasmid with mCherry at N-terminus of Sbg1p (cps1-191+pmCherry-Sbg1—MBY9285) at 24°C, 34°C and 36°C–shift up for 3 hr. Images are inverted for Sbg1p fluorescence. Arrowheads indicate presence of mCherry-Sbg1p signal at the division site while asterisk marks the absence of it. (n = 2, 50 cells). (H) Tetrad dissection analysis of a cross between sbg1-3 and cps1-191. Boxes indicate double mutant sbg1-3 cps1-191. Scale bar 5μm.

