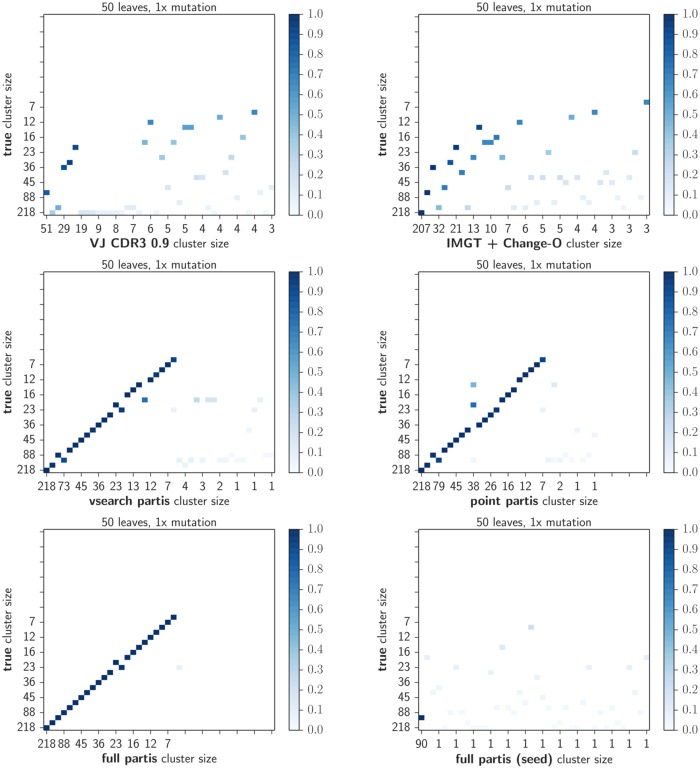
Fig 3. Fraction of sequences per cluster in common with the true partition on simulation for each method at typical (1×) levels of mutation.
For these plots, we took the 40 largest clusters resulting from the given clustering and took their intersection with the 40 largest clusters generated by the simulation. Each non-white square indicates that there was a non-empty intersection between the two clusters; the square is shaded by the size of the clusters’ intersection divided by their mean size. The position of the square shows the relative sizes of the two clusters. Results are shown for the simulation sample in which the size of each clonal family is drawn from a geometric distribution with mean 50 (other values are shown in S6 and S8 Figs).

