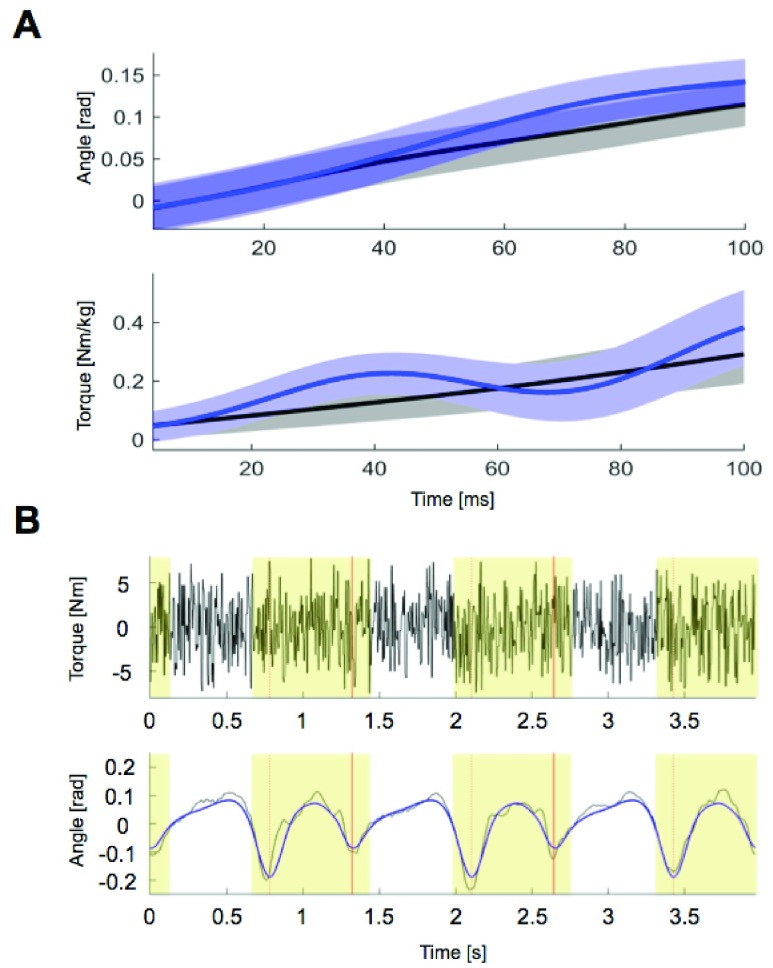
FIGURE 2.
Samples of inputs and outputs for the estimation of ankle impedance. A: Data during the analysis window (100 ms) from the Perturberator Robot. Time window begins with onset of the perturbation. Black: non-perturbed, Blue: perturbed. B: Sampled measurements from the Anklebot (3 gait cycles). Random torque inputs (top) and the corresponding angles (black curve - blue curve; bottom). The blue curve is the nominal angle trajectory. Only the data in the shaded region (from pre-swing phase to early-loading response) were used. Red bars represent heel-strike.

