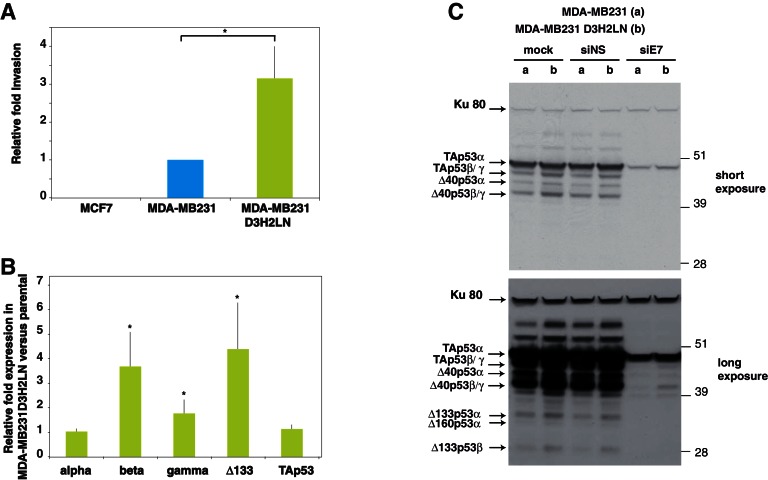
Figure 2. p53 isoform expression correlates with cell invasiveness in breast cancer cells.
(A) Invasion of breast cancer cell lines. MCF7, MDA-MB231 and MDA-MB231 D3H2LN cells were assayed for 24 hr and the changes in invasion were analyzed, as described in Materials and methods (Smith et al., 2008). Invading cells were counted as the number of invading cells at 50 μm divided by the number of non-invading cells at 0 µm. The results are expressed as the fold change ratio compared with MDA-MB231. Each assay was performed in triplicate for each cell line. The values plotted are means ± SEMs of N = 4 independent experiments; *p<0.05. (B) Comparative expression of p53 mRNA variants in MDA-MB231 D3H2LN versus parental MDA-MB231 cells. The expression level of p53 isoform mRNA is higher in the highly invasive MDA-MB231 D3H2LN cells than in MDA-MB231 cells. Sub-confluent proliferating breast cancer cells were harvested for quantitative RT-qPCR Taqman assays (see Materials and methods section). p53 isoform expression was quantified relative to the control MDA-MB231 cell line. For all RT-qPCR experiments, expression levels of p53 isoforms were normalized to TBP. Results are expressed as the fold change compared to MDA-MB231 cells and represent means ± SEMs of N = 4 independent experiments; *p<0.05. (C) Differential expression of endogenous p53 protein isoforms in MDA-MB231 and MDA-MB231 D3H2LN cells. The protein expression levels of p53 isoforms were analyzed by western blotting using the sheep polyclonal p53 pantropic antibody (Sapu). To identify p53 protein isoforms, cells were transfected either with p53 siRNA (siE7) targeting exon-7 common to all p53 mRNA variants or with control siRNA (siNS, non specific). Two exposures (short and long) are shown.

