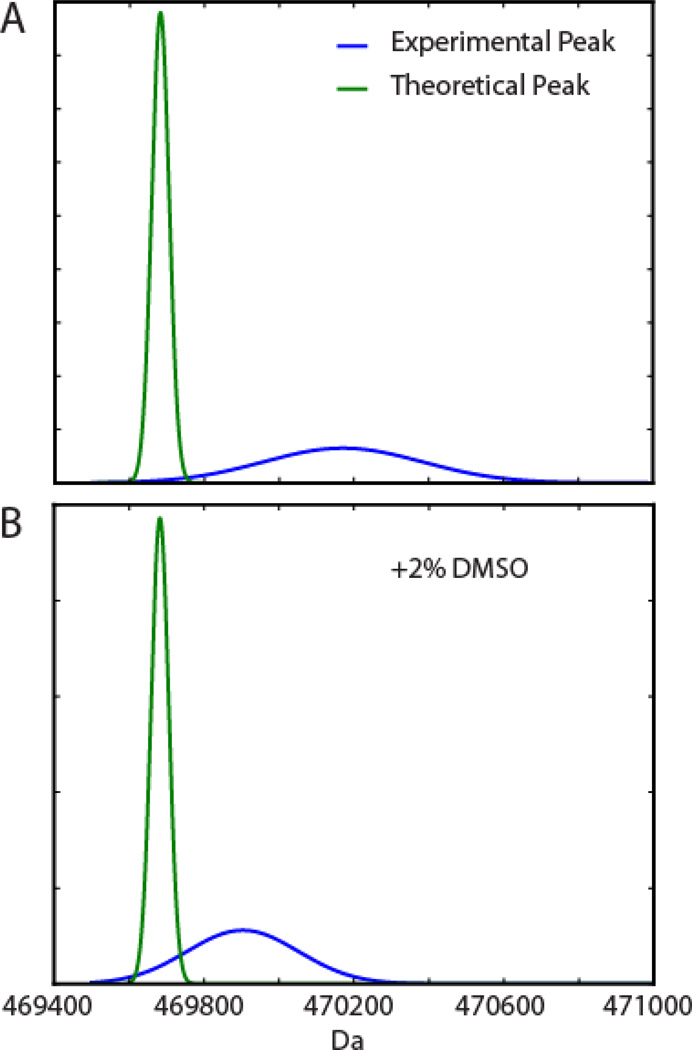
Figure 1.
Peak broadening by insufficient desolvation. (A): pol II 10-mer theoretical mass peak (green trace, peak width due to isotope distribution) and experimental peak (blue, wider peak due to adducts and hydration) in 100 mM ammonium acetate. (B): pol II 10-mer theoretical peak and experimental peak in 100 mM ammonium acetate and 2% DMSO. Peak areas were normalized for both theoretical and experimental peaks.

