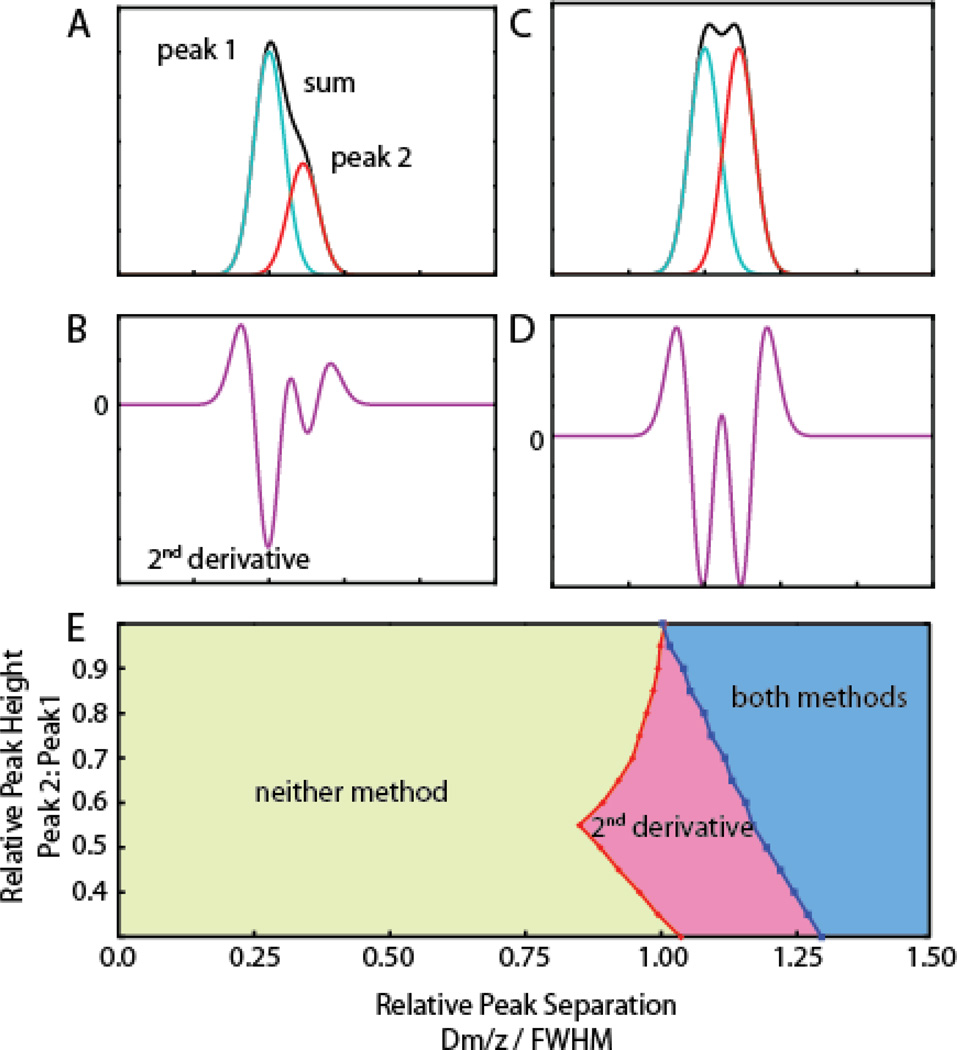
Figure 2.
Effectiveness of peak detection methods in detecting overlapping ion signals. Peak overlap is modeled by two standardized Gaussian functions of equal variance. The effect of varying the intensity of the 2nd signal (rightmost) relative to the 1st as well as the relative spacing of the signal centroids (plotted as the difference in centroid m/z divided by full width at half maximum) on the performance of peak detection methods was evaluated. A) Peak 2 is half the height of peak 1 with centroids separated by 1 unit of FWHM, and appears as a shoulder in the summed signals. Local maxima detection fails to register the shoulder peak. B) The second derivative shows two local minima separated by zero-crossings indicating that the spectrum contains two underlying peaks. C) When the two signals have equal intensity both local maxima and second derivative detection find the two peaks. D) Second derivative of C). E) State diagram indicating the ranges in which two peaks are successfully deconvoluted by both 2nd derivative and local maxima detection (blue), 2nd derivative only (red), or neither method (green).

