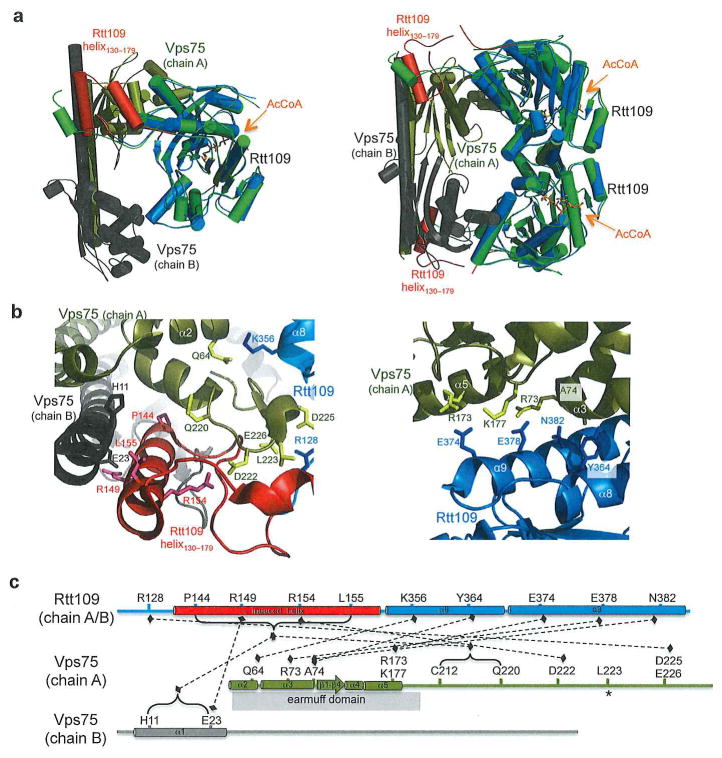
Figure 4.
Rtt109/Vps75 complex (a) Side by side comparison of the Vps75/Rtt109 in the 2:1 stoichiometry (left) and 2:2 stoichiometry (right). Note that in the 2:2 model residues 129–133 are not modeled. The uncomplexed Rtt109 is shown in green and the complex is shown as follows: Rtt109 in marine, Vps75 chain A in gold, Vps75 chain B in gray, AcCoA in orange. (PDB codes: 2ZFN, 3Q68, and 3Q33). (b) Zoomed in view of select interactions between Rtt109 and Vps75. Left- interactions between Rtt109 and chains A and B of Vps75. Right- Interactions between Rtt109 and the earmuff domain of Vps75 chain A. (c) Linear representation of select interactions between Rtt109 and chains A and B of Vps75 that occur in both the 2:1 and 2:2 model. Domain and secondary structure naming correspond to primary texts. Asterisk denotes residue that is inserted into hydrophobic pocket of binding partner.

