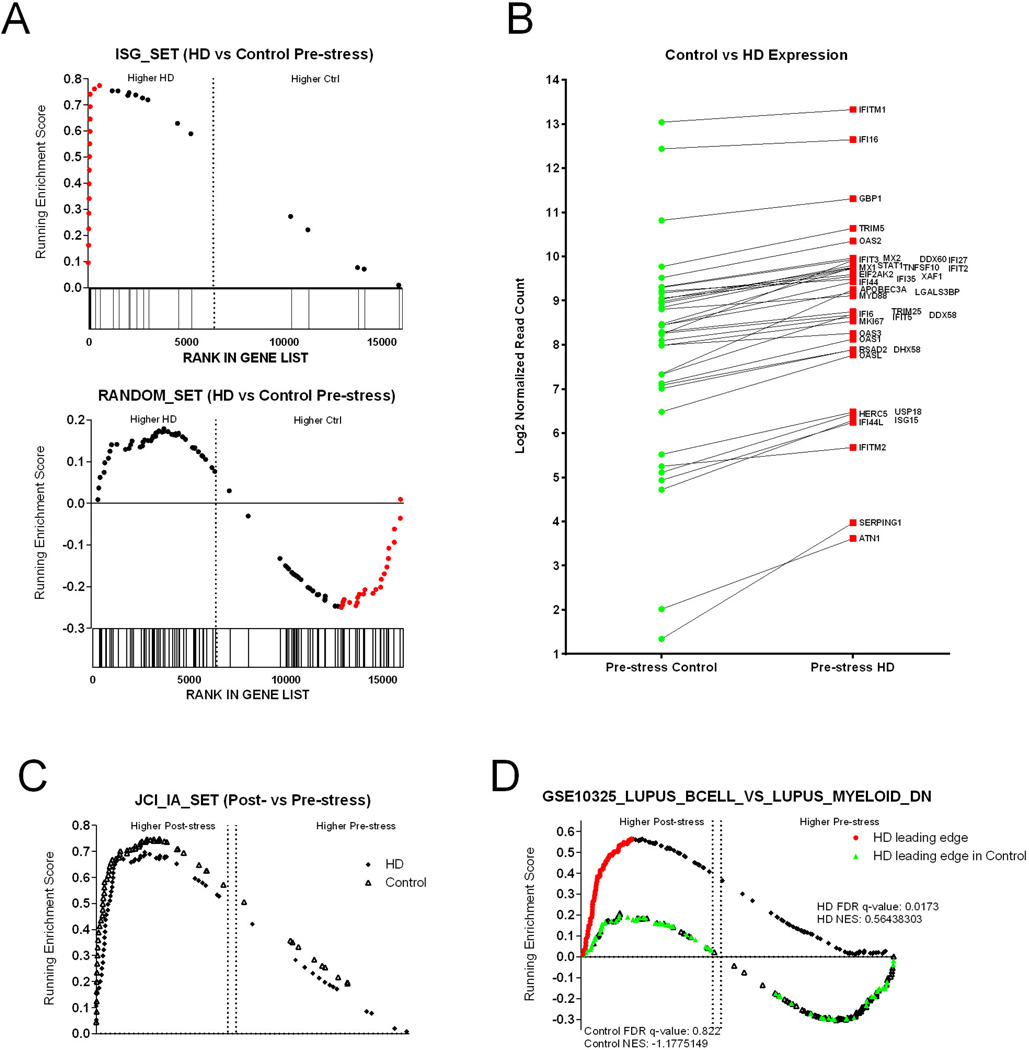
Figure 3. Gene Expression Changes on the Human Intruder task.
(A) Gene set enrichment plots (GSEA) of two gene families, Interferon Stimulated Genes (ISGs) showing overexpression in the HD samples and a random set of genes showing no enrichment in either phenotype. The running enrichment score (y axis) is plotted by each gene’s individual rank (x axis); bars below the x axis indicate individual gene ranks in the whole data set. The ranking is based on relative gene expression between HD and controls. Genes in the leading edge (contributing the most to the enrichment score) are shown in red. (B) The mean log2 normalized read counts of the leading-edge genes are shown between the control and HD monkeys. (C) GSEA plots of Pre- vs Post-stress for both controls and HD monkeys showing Post-stress enrichment for both groups. (D) GSEA plots of Pre- vs Post-stress for controls and HD showing Post-HI enrichment in only the HD group. The genes in the leading edge of the HD group are shown in red along the HD enrichment distribution and those same genes are shown in green along the control enrichment distribution showing no enrichment for the control animals.

