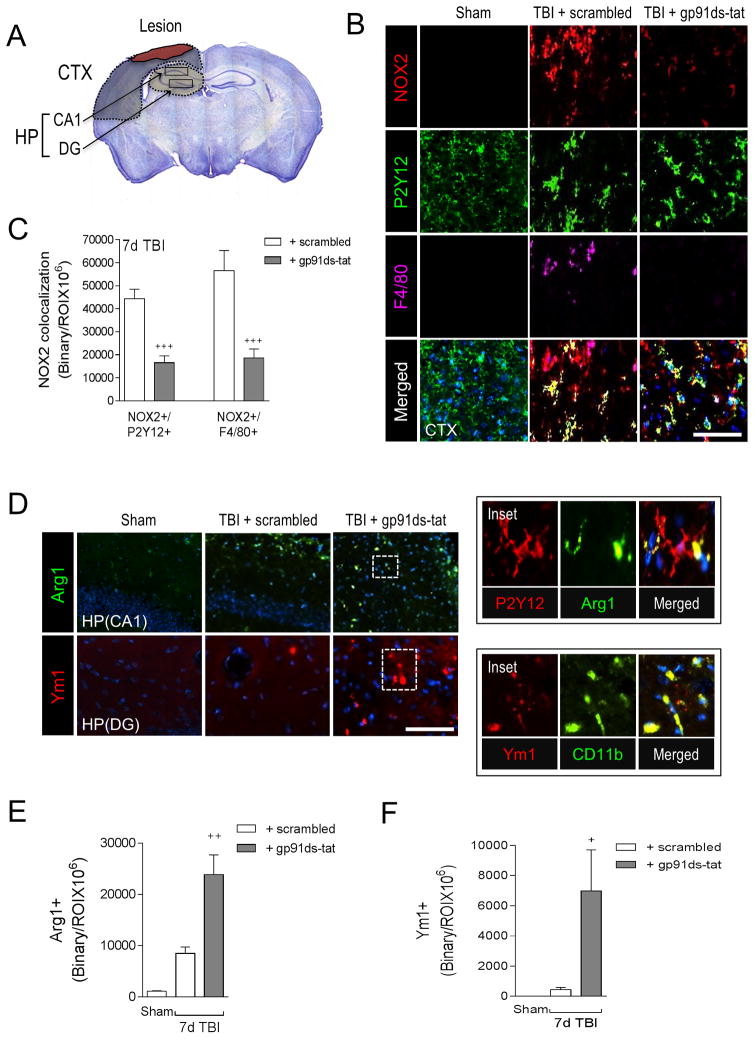
Figure 8. A selective NOX2 peptide inhibitor, gp91ds-tat, promotes M2-like activation after CCI.
(A) Image analysis was performed in the peri-lesional cortex (CTX) and hippocampus (HP) at −2.06mm from bregma as outlined. (B) Representative images from the ipsilateral cortex of sham, scrambled- or gp91ds-tat- treated CCI mice at 7d post-injury. Immunofluorescence analysis of NOX2 (red), P2Y12 (green), and F4/80 (magenta) demonstrate that gp91ds-tat treatment decreased NOX2 expression in P2Y12+ microglia and F4/80+ brain macrophages at 7d post-injury. Scale bar = 50μm. (C) Quantification of NOX2+/P2Y12+ and NOX2+/F4/80+ colocalization in the cortex of scrambled- and gp91ds-tat-treated CCI mice. gp91ds-tat treatment significantly reduced NOX2+/P2Y12+ and NOX2+/F4/80+ expression after CCI. Student’s t-test; data = mean ± SEM; n = 5/time point; +++p<0.001 versus scrambled-treated CCI group. (D) Representative images from the ipsilateral hippocampus of scrambled- or gp91ds-tat-treated CCI mice at 7d post-injury. Immunofluorescence analysis of Arg1 (green) and Ym1 (red) demonstrates that gp91ds-tat treatment increased Arg 1 and Ym1 expression in the hippocampus at 7d post-injury. Scale bar = 50μm. Inset demonstrates that within the injured hippocampus Arg1 (green) colocalized with P2Y12 (red) cells, and Ym1 (red) colocalized with and CD11b (green) cells. (E, F) Quantification of Arg1+ and Ym1+ cells in the hippocampus of scrambled- and gp91ds-tat-treated CCI mice. Student’s t-test; data = mean ± SEM; n = 5/time point; +p<0.05 versus scrambled-treated CCI group.

