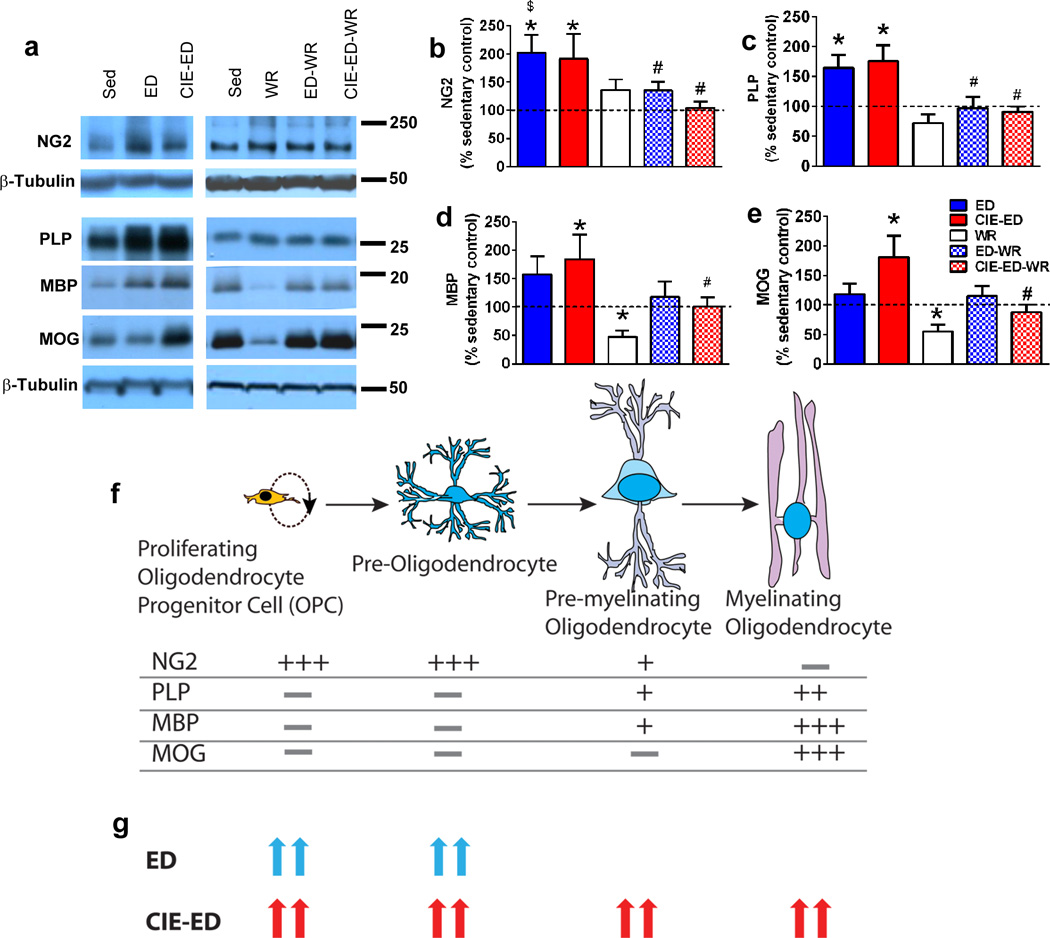
Figure 4.

(a) Representative immunoblot of NG2, PLP, MBP and MOG with corresponding blots for β-tubulin which was used as loading control. (b–e) Densitometric analysis of NG2 (b), PLP (c), MBP (d) and MOG (e) indicated as percent change from sedentary control. (f) Cartoon representation of different developmental stages of OPCs and corresponding levels of expression of proteins investigated in our study. The schematic is based on reviews from (Nishiyama et al., 2009, Barateiro and Fernandes, 2014). (g) Summary of the change in expression levels of OPC proteins tested in ED and CIE-ED animals compared to sedentary controls. Data are represented as mean ± S.E.M.; n=6–12 each group. *p<0.05 vs. sedentary control, $p<0.05 vs. WR, #p<0.05 vs. respective sedentary ethanol control groups.
