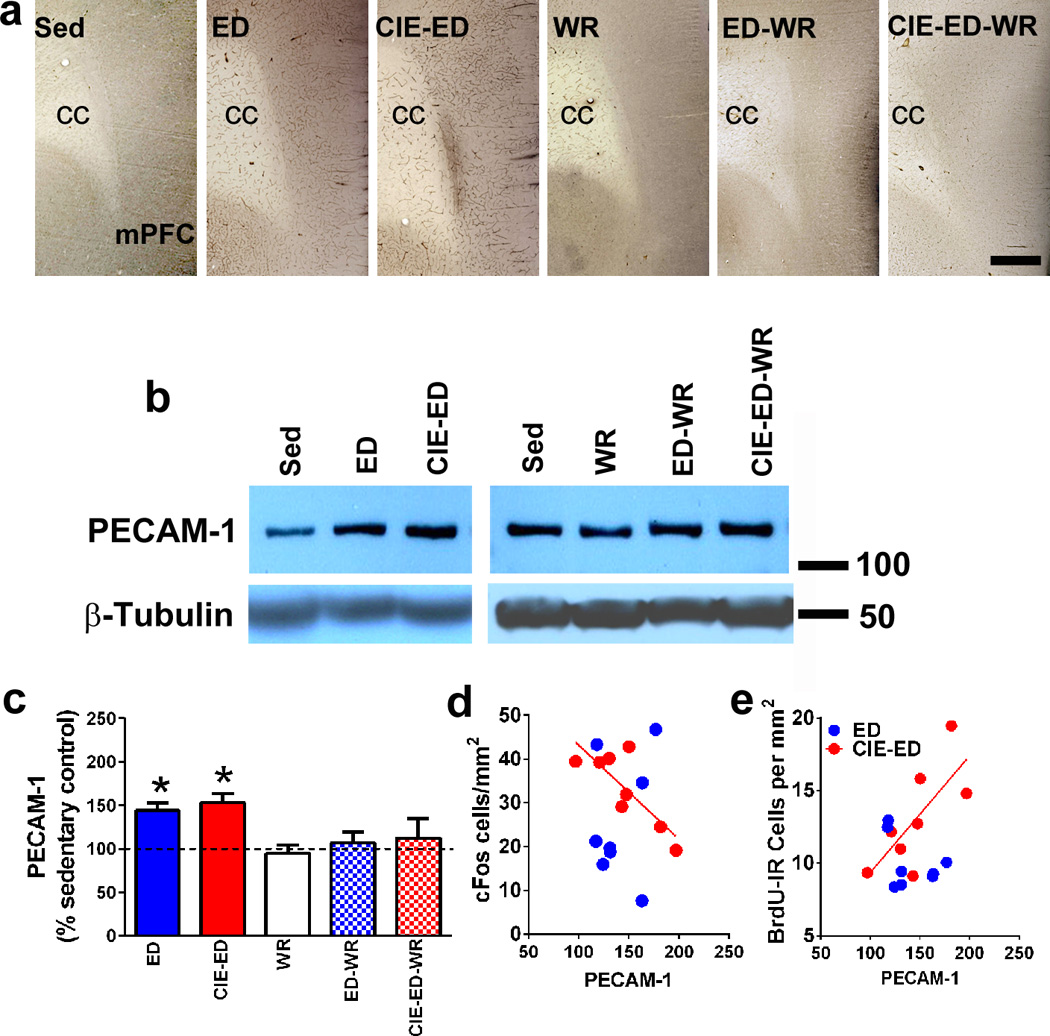
Figure 5.

(a) Qualitative images of the mPFC stained with PECAM-1 from sedentary, ED, CIE-ED, WR, ED-WR and CIE-ED-WR rats. Scale bar in CIE-ED-WR panel is 100um applies to all images in (a); cc is corpus callosum. (b) Representative immunoblot of PECAM-1 with corresponding blot for β-tubulin which was used as loading control. (c) Densitometric analysis of PECAM-1 indicated as percent change from sedentary control. *p<0.05 vs. sedentary control. Data are represented as mean ± S.E.M.; n=6–12 each group. (d–e) PECAM-1 expression negatively correlates with the number of cFos cells (d) and positively correlates with the number of BrdU cells (e) in the mPFC in CIE-ED rats.
