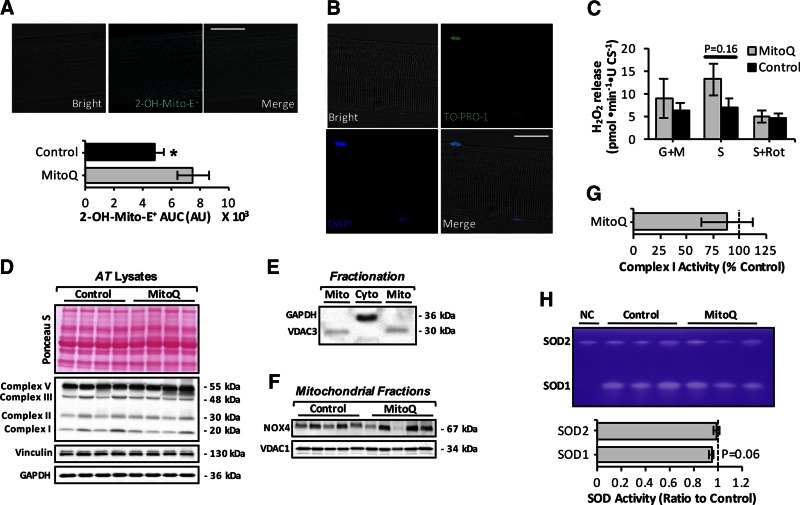
Figure 2.
Effect of long-term mitoquinone mesylate (MitoQ) administration on mtROS in skeletal muscle of old mice. A) Upper panels: representative images of single fiber isolated from AT muscle under bright-field fluorescent image after loading with MitoSOX Red (20 nM, cyan) and merged image as indicated and analyzed by confocal microscopy. Original magnification, ×60. Scale bar, 25 μm. Lower panel: statistical analysis of area under mitochondrial 2-OH-Mito-E+ fluorescence trace (area under curve) over 60 min for control old mice and mice treated with MitoQ for 15 wk (24–28 mo old), arbitrary units (AU). 2-OH-Mito-E+ fluorescence was normalized to CS activity. *P < 0.05 compared to values from MitoQ-treated old mice (n = 12 fibers, 5–6 mice per group). B) Confocal images of saponin-permeabilized fiber isolated from AT muscle under bright-field fluorescent image after loading with To-Pro-1 iodide (200 nM, green) and DAPI (1 μg/ml, blue); merged image as indicated and analyzed by fluorescence microscopy. Original magnification, ×60. Scale bar, 25 μm. C) Mitochondrial H2O2 production (normalized per CS activity) assessed in permeabilized fiber bundles prepared from AT muscle of control and MitoQ-treated old mice. Mitochondrial substrates and inhibitors—glutamate and malate (G/M; 5 mM for both), succinate (S; 10 mM), and rotenone (Rot; 1 μM)—were added as indicated (n = 5–6 mice per group). D) Protein levels of oxidative phosphorylation (oxphos) complexes (I, II, III, and V) from AT muscle of control and MitoQ-treated old mice. Intensity of bands shown in Ponceau S–stained gel (upper) was equivalent to GAPDH and vinculin protein levels (lower) and were used as loading controls. E) Representative Western blot of GAPDH and voltage-dependent anion channel 3 (VDAC3) content to illustrate purity of extracted mitochondrial (Mito) and cytosolic (Cyto) skeletal muscle fractions. F) Protein levels of NOX4 in skeletal muscle mitochondrial fractions of control and MitoQ-treated old mice. G) Rotenone-sensitive respiratory chain complex I activity in AT skeletal muscle homogenates of control and MitoQ-treated old mice (n = 5–6 mice per group). H) Native gels stained for SOD1 and SOD2 enzyme activities in AT skeletal muscle of control and MitoQ-treated old mice (upper) and densitometric quantification of bands (lower). Negative control (NC) included AT muscle lysate from Sod1-null mice.

