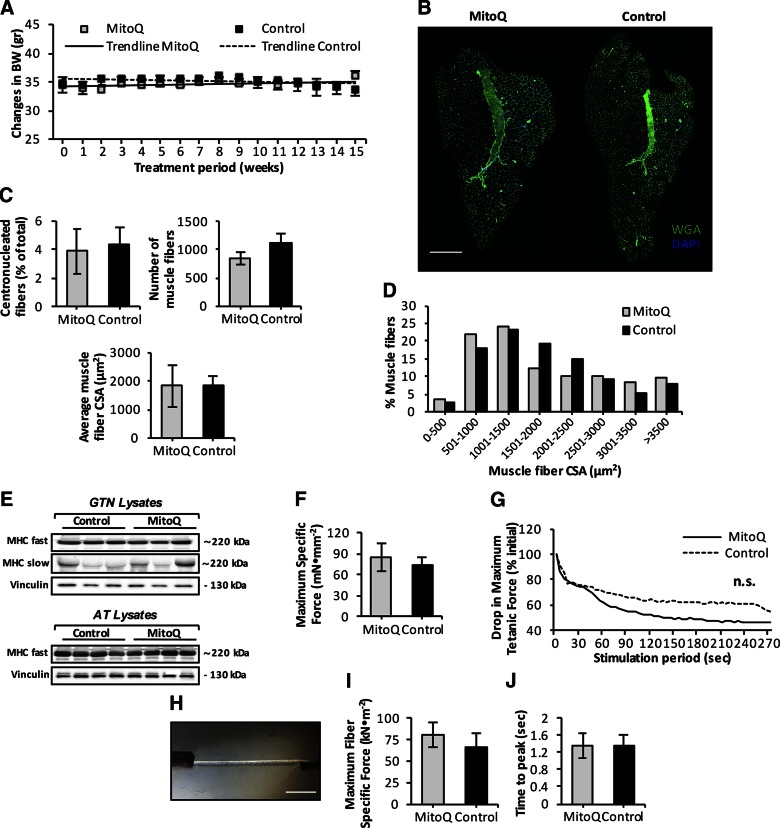
Figure 8.
Effect of long-term mitoquinone mesylate (MitoQ) treatment on age-related loss of muscle mass and function. A) Time course of changes in mouse BW during 15 wk of mito-targeted MitoQ administration. Trend lines indicate no changes in BW during treatment period; BW was monitored weekly (n = 5–6 mice per group). B) Transverse sections of AT muscle from 28-mo-old control and MitoQ-treated mice obtained after 15-wk treatment period, and stained with WGA (5 μg/ml, green) to visualize extracellular matrix and DAPI (1 μg/ml, blue) to mark nuclei. Scale bar, 400 μm. C) Percentage of fibers showing centrally located nuclei in AT muscle of control and MitoQ-treated old mice (upper left); total number of muscle fibers in AT muscle of control and MitoQ-treated old mice (upper right); mean CSA of individual fibers from AT muscle of control and MitoQ-treated old mice (n = 5–6 mice per group; lower). D) Frequency distribution of fiber CSA of AT muscle from control and MitoQ-treated old mice (n = 5–6 mice per group). E) Representative Western blots of fast [myosin heavy chain (MHC) fast] and slow (MHC slow) MHC content in gastrocnemius (GTN, upper) and AT muscle (lower) of control and MitoQ-treated old mice. F) Maximum isometric specific force measured in situ, normalized to total fiber CSA of EDL muscle from control and MitoQ-treated old mice (n = 5–6 mice per group). G) In situ measurements of drop in maximum isometric specific force of EDL muscle during series of repeated isometric contractions (300 ms at 100 Hz every 5 s), expressed as percentage of initial force. Lines represent average response of 5 muscles (n = 5 mice per group). Although MitoQ-treated old mice showed tendency to greater decline in isometric force production during fatiguing protocol compared to controls, data were are not statistically significantly. H) Image of skinned myofiber isolated from AT muscle of 28-mo-old mouse attached to force transducer and high-speed length controller. Scale bar, 350 μm. I) Ex vivo measurements of maximum fiber specific force normalized to fiber CSA of skinned myofibers isolated from AT muscle of control and MitoQ-treated old mice (n = 25 fibers, 5 mice per group). J) Ex vivo measurements of time to peak maximum tension of skinned fibers isolated from AT muscle of control and MitoQ-treated old mice (n = 25 fibers, 5 mice per group).

