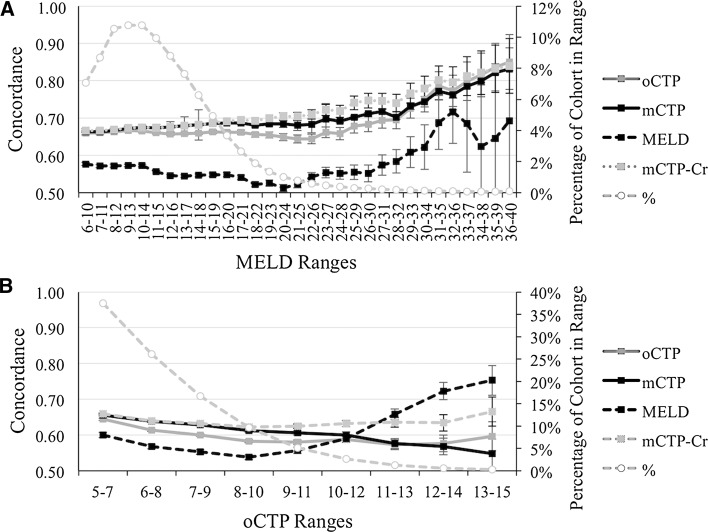
Fig. 2.
Impact of varying clinical severity on concordance of oCTP, mCTP, mCTP-Cr, and MELD on 5-year transplant-free survival. a The 2008 quarter 1 cohort was serially subsetted by five-point MELD ranges and the C-statistics for oCTP (solid gray), mCTP (solid lack), mCTP-Cr (dashed gray, solid marker), and MELD (dashed black) plotted. The percentage of patients in each subset is plotted on the secondary axis (gray dotted line, round marker). b The 2008 quarter one cohort was serially subsetted by three-point oCTP ranges and the C-statistics for oCTP (solid gray), mCTP (solid lack), mCTP-Cr (dashed gray, solid marker), and MELD (dashed black) plotted. The percentage of patients in each subset is plotted on the secondary axis (gray dotted line, round marker)

