Figure 7.

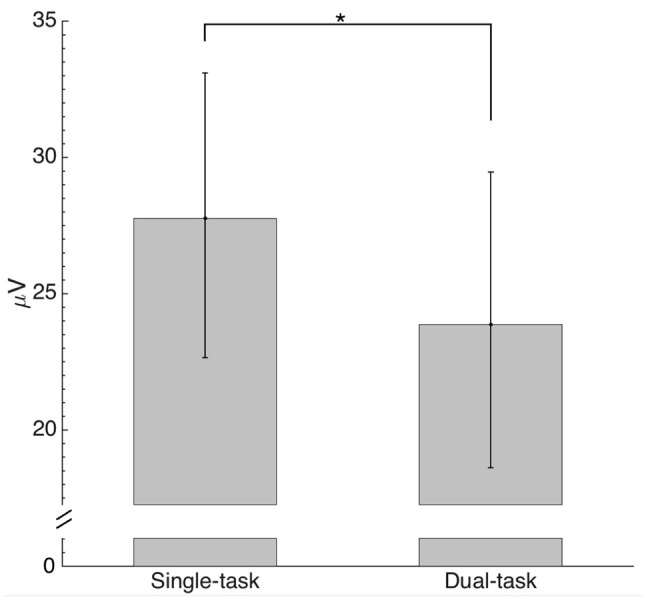
Comparison of absolute maximum envelope values for the N1 back projected from estimated domains (individual peak values between 90 and 170 ms) by condition. The asterisk indicates a significant difference (p < 0.05).

Comparison of absolute maximum envelope values for the N1 back projected from estimated domains (individual peak values between 90 and 170 ms) by condition. The asterisk indicates a significant difference (p < 0.05).