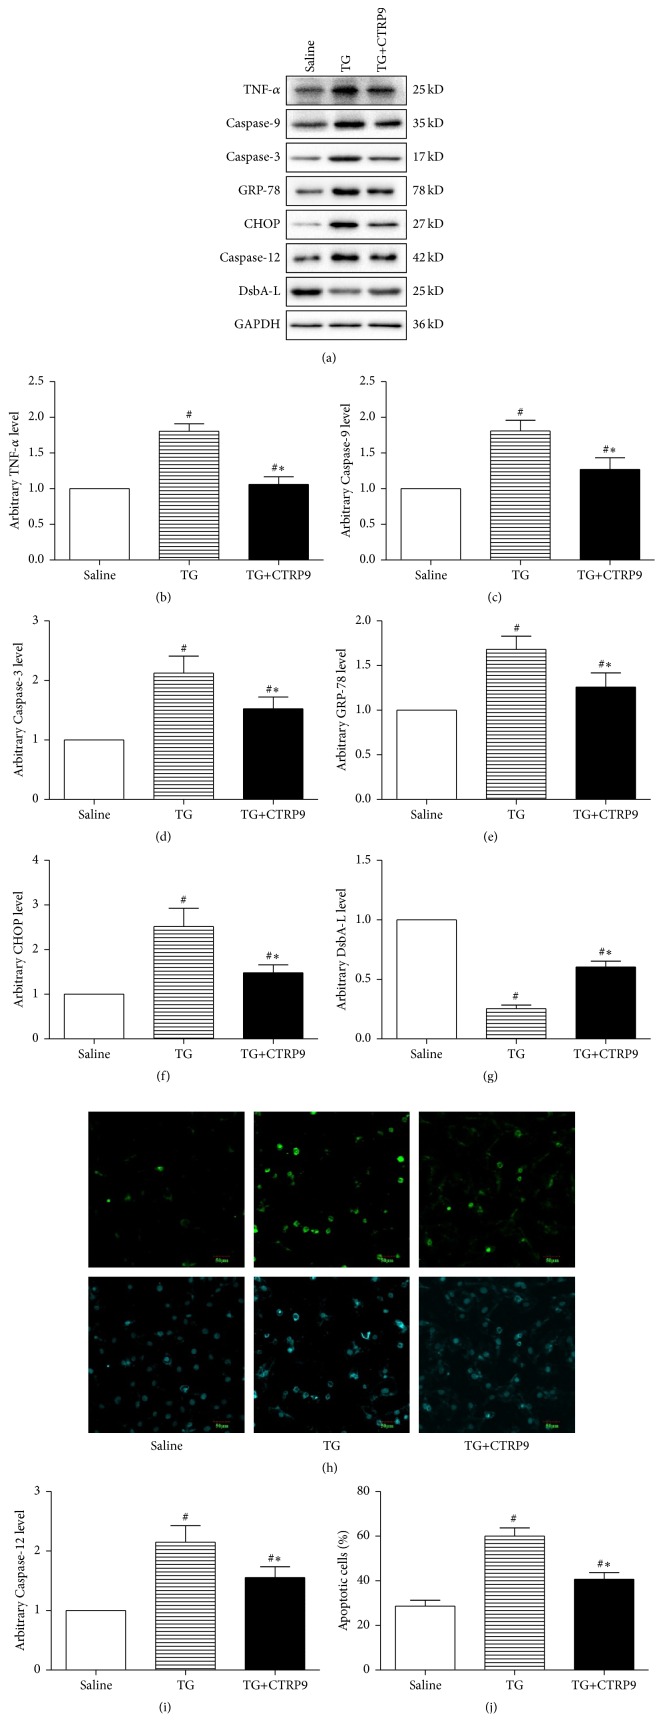
Figure 3.
CTRP9 protected ER stressed H9c2 cardiomyocytes against SIR injury. H9c2 cells were pretreated with globular CTRP9 (1 μg/mL) or equal amount of saline for 24 h followed with TG (0.01 μM/L) cotreatment for 24 h. Representative images (a) and bar graphs of TNF-α (b), Caspase-9 (c), Caspase-3 (d), Caspase-12 (i), GRP-78 (e), CHOP (f), and DsbA-L (g) and in H9c2 cardiomyocyte determined by Western blots. GAPDH was used as loading control. Representative images (h) and bar graph (j) of apoptotic cardiomyocytes were shown. The apoptotic cells were detected by immunofluorescent staining with TUNEL ((h), upper panel), and DAPI staining was used to label the nuclei ((h), lower panel). The results were expressed as the mean ± SEM, n = 6 per group. # p < 0.01 compared with cells treated with saline; ∗ p < 0.01 compared with cells treated with TG.

