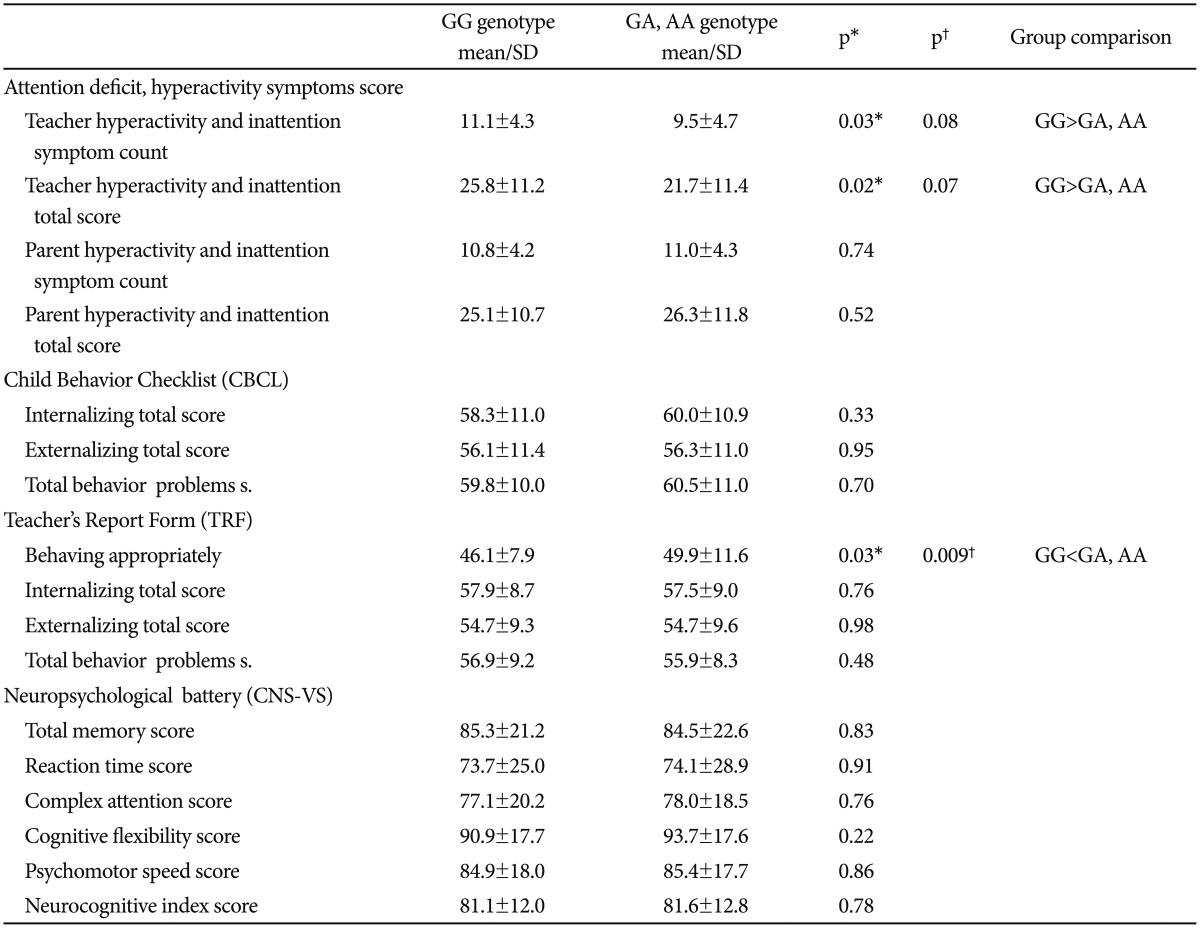
Table 3. Comparison of genotype groups in terms of symptoms and neuropsychological findings in patients.
*independent simples t-test, statistically significance p<0.05, †multivariate analysis of variance (MANOVA) by assigning the age and gender as covariates (Post-hoc comparisons were carried out using Bonferroni correction and less than 0.025 p values were accepted as statistically significant)

