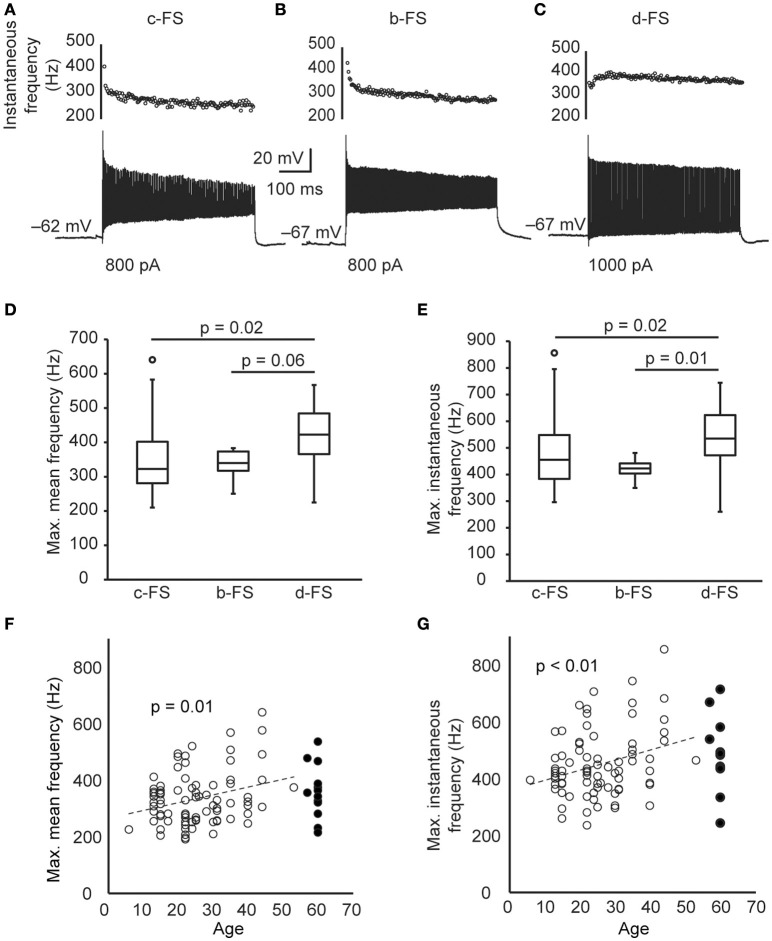
Figure 2.
The maximal firing frequency of human cortical FS neurons. (A–C) The Vm responses composing the highest number of APs of the same FS neurons in Figures 1A–C in response to 500-ms current steps. Dot plots are the corresponding instantaneous AP frequency. (D) The maximal mean AP frequency induced by 500-ms current steps of human FS neurons. (E) The maximal instantaneous AP frequency of human FS neurons. (F–G) The scatter plot of the maximal mean frequency (F) and the maximal instantaneous frequency (G) of human FS neurons vs. patient age. Dashed lines are the linear fit. Open and filled circles are epileptic and non-epileptic neurons, respectively. The circles in box-whisker plots are the maximal or minimal outliers.

