Figure 4.
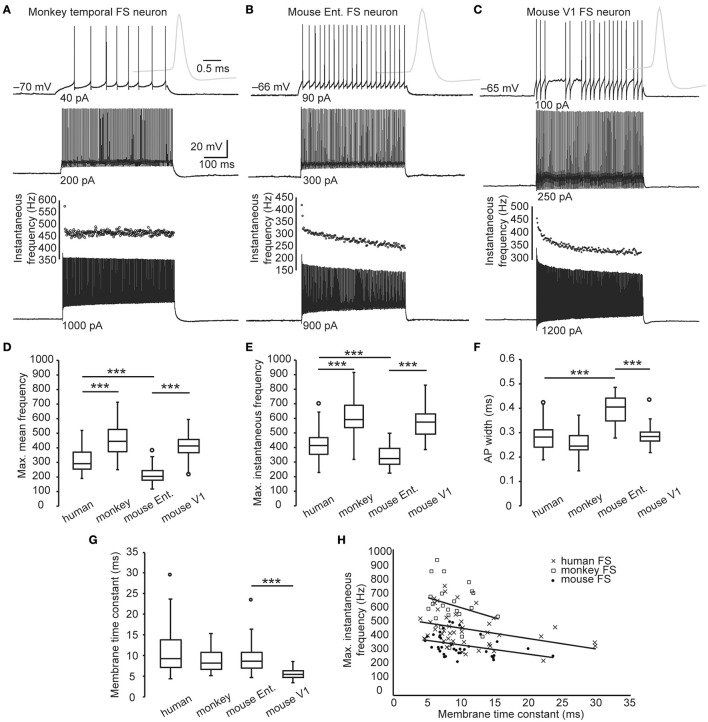
Maximal firing frequency of monkey and mouse FS neurons. (A–C) The Vm traces of FS neurons from monkey (A), mouse entorhinal (B), and V1 cortex (C) in response to supra-threshold current steps (500 ms in duration). Gray traces are expanded view of the first APs. Dot plots indicate the corresponding instantaneous AP frequency of the Vm responses composing the highest number of APs. (D–E) Comparison of the maximal firing frequency of monkey, human, and mouse FS neurons. (F) Comparison of the AP width between different species. (G) Membrane time constants of human, monkey and mouse FS neurons. (H) The scatter plot of the maximal instantaneous frequency vs. membrane time constants of each cortical FS neurons from human (cross), monkey (box), and mouse (dot). Solid lines are linear fits for each species. Ent., entorhinal cortex. The circles in box-whisker plots are the maximal or minimal outliers. ***, p < 0.005, Wilcoxon rank sum test.

