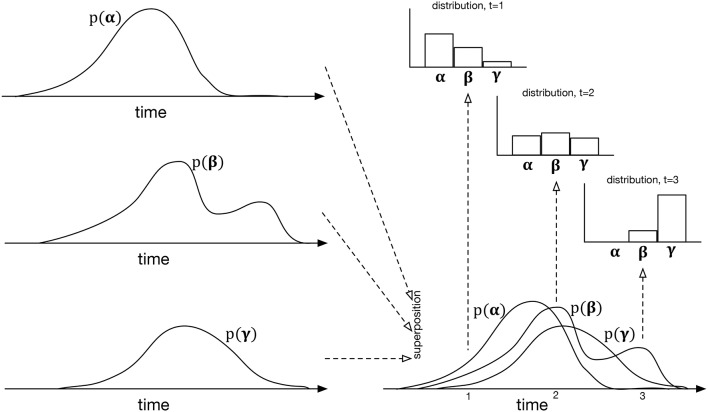
Figure 4.
The process of generating IDyOT dynamic distributions over an imaginary alphabet of three symbols, α, β, and γ. The left side of the figure shows the time distribution for each symbol as generated from observed experience. These distributions may be notionally superposed, giving the bottom right diagram—however, note that this is for the purposes of illustration only: it is not intended to represent a combined distribution of any kind. Instead, given the superposition of temporal distributions, instantaneous ones may be generated, cutting “across” the temporal ones, the examples shown here being at t = 1, 2, 3. The resulting model is similar to a Markov renewal process (Ross, 1992), but extends the idea to hierarchical structure.

