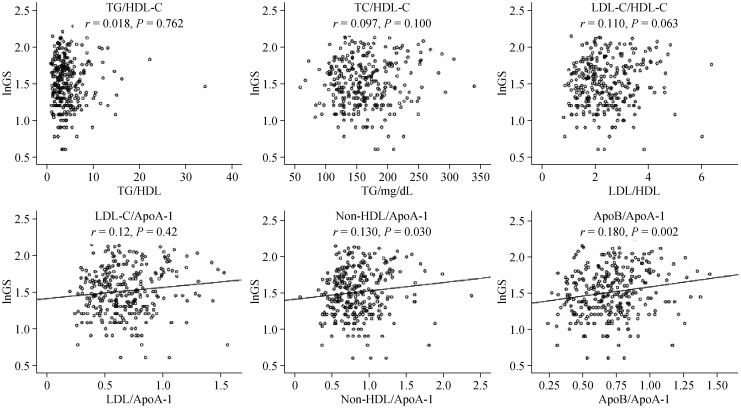
Figure 1. The correlation of the lipid and lipoprotein ratios with lnGS in type 2 DM.
Pearson's correlation analysis was performed. ApoA-I: apolipoprotein A-I; ApoB: apolipoprotein B; DM: diabetes mellitus; GS: Gensini score; HDL-C: high density lipoprotein cholesterol; LDL-C: low density lipoprotein cholesterol; TC: total cholesterol; TG: triglycerides.

