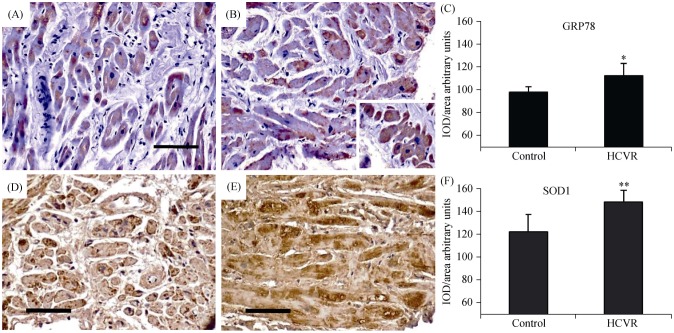
Figure 3. GRP78 (A-C) and SOD1 (D-F) immuno-staining.
(A): In cardiomyocytes from Control patients, the staining is weak to moderate and is concentrated in the cytoplasm, sometimes near the nucleus; (B): in cells from HCVR patients, GRP78 staining is more intense. Some cells are clustered and much intensely stained (insert); (C): relative values of optical density according to groups; (D): the staining is faint to moderate in all cells from Control patients; more intense staining is concentrated in some areas of the cytoplasm; (E): all cardiomyocytes from HCVR patients show intense staining uniformly distributed within the cytoplasm; (F): relative values of optical density according to groups. Original magnification 100 ×; scale bar = 20 µm; *P < 0.05; **P < 0.01. GRP78: glucose-regulated protein 78; HCVR: higher cardiovascular risk; IOD: integrated optical density; SOD1: superoxide dismutase-1.

