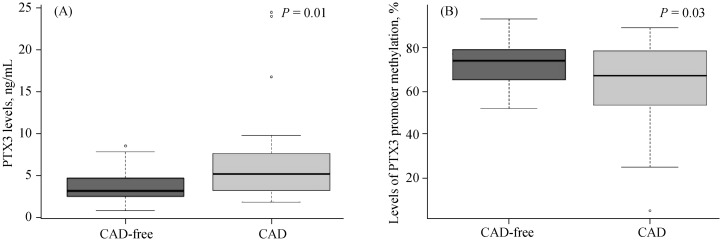
Figure 1. PTX3 levels and levels of PTX3 promoter methylation according to CAD occurrence.
(A): PTX3 levels in the CAD-free group were 3.65 ± 2.14 ng/mL (n = 25), lower than the CAD group (n = 39); (B): the levels of PTX3 promoter methylation in the CAD-free group were 72.45% ± 11.84% (n = 25), higher than the CAD group (62.69% ± 20.57%, n = 39). CAD: coronary artery disease; PTX3: Pentraxin 3.

