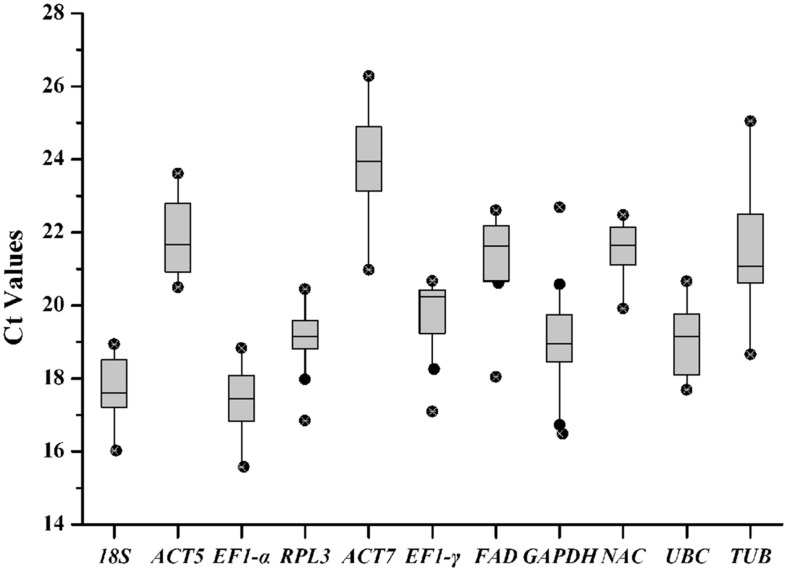
FIGURE 2.
Quantitative real-time polymerase chain reaction Ct values for reference genes. Ct values for each reference gene in all of the R. molle samples. A line across the box denotes the median. The box denotes the 25 and 75% percentiles, whisker caps represent maximum and minimum values, and dots represent outliers.

