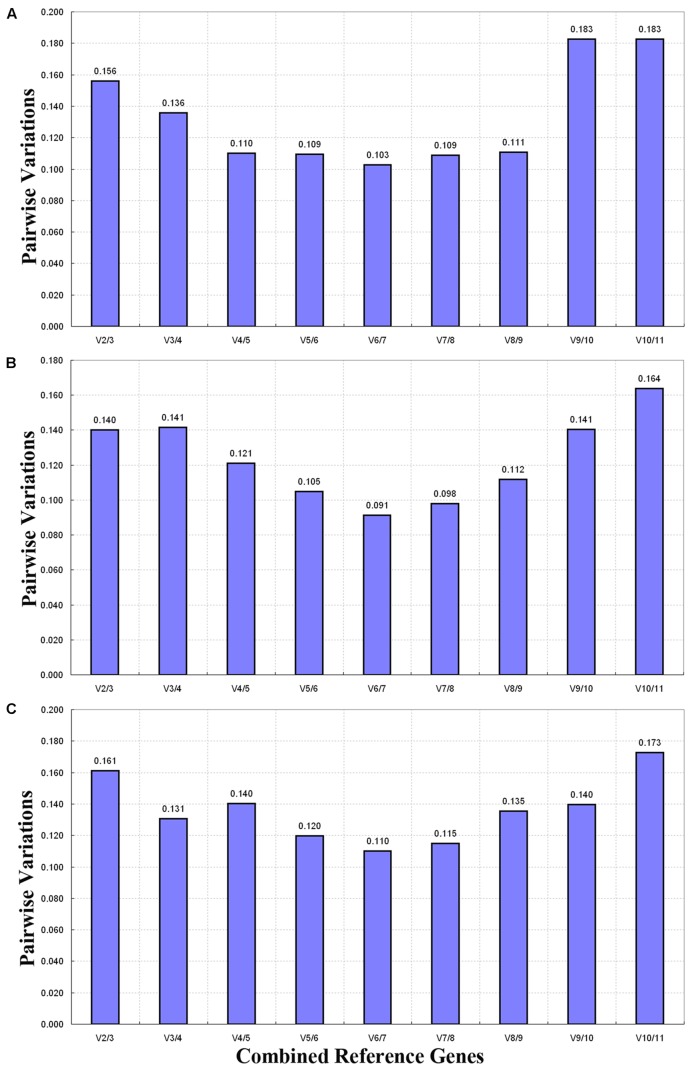
FIGURE 4.
Pairwise variation (V) calculated through GeNorm to determine the optimal number of reference genes. The average pairwise variation (Vn/Vn+1) between normalization factors NFn and NFn+1was analyzed to determine the optimal number of reference genes required for qRT-PCR data normalization in different samples. (A) Different tissues, (B) flower samples of different developmental stages, and (C) all samples.

