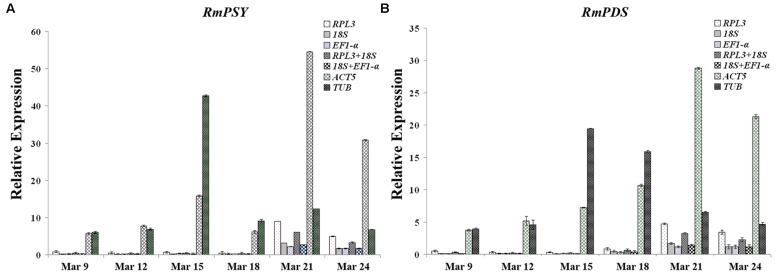
FIGURE 5.
Expression levels of RmPSY and RmPDS throughout the flower development of R. molle. (A) Expression levels of RmPSY at different stages of flower development. (B) Expression levels of RmPDS at different stages of flower development. Genes were normalized to different reference genes. Error bars show the standard error calculated from three biological replicates.

