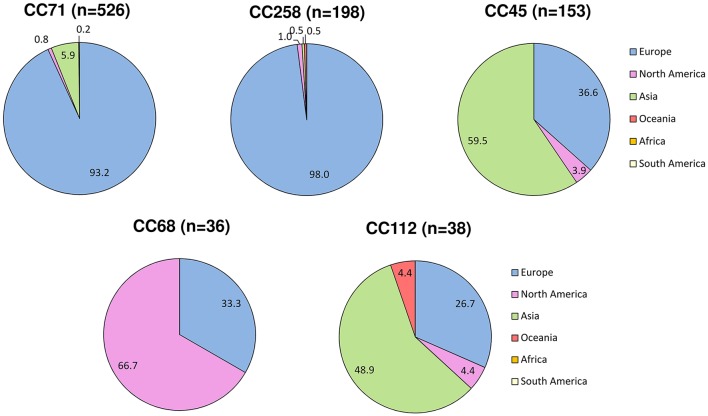
Figure 4.
Geographic variation in the reported frequency of major MRSP clonal complexes based on data from the MLST database (http://pubmlst.org/spseudintermedius/) and references given in Table S1. The numbers represent the percentage (%) of MRSP isolates from each lineage that was reported in each continent.

