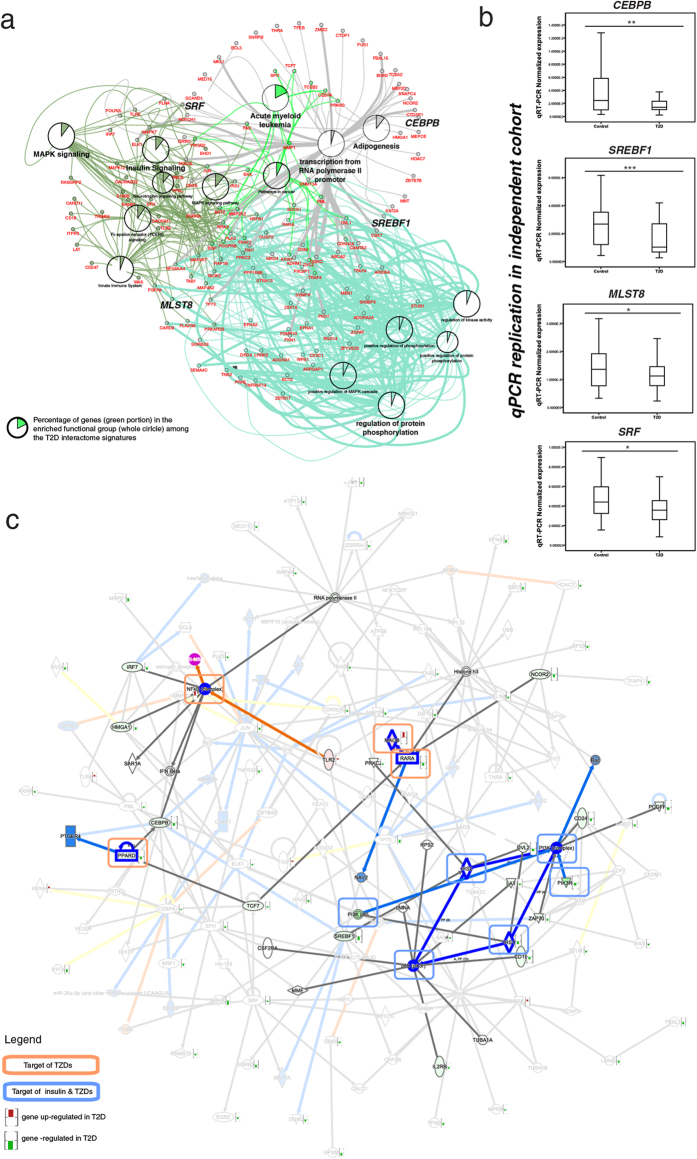
Figure 2. Functional analysis of the T2D Interactome Signatures.
(a) Functional analysis of the T2D interactome signatures revealed enrichment of genes related to insulin signaling, MAPK signaling, acute myeloid leukemia, transcription, adipogenesis and regulation of protein phosphorylation. Color(s) of the nodes and the line connected to the functional grouping(s) indicate the function(s) of the respective gene. The thickness of the edge represents the evidence code of the Gene Ontology that relates the gene (node) to the functional term. The thicker edge represents those with experimental evidence code. (b) The dysregulation of expression of SREBF1, CEBPB, MLST8 and SRF was replicated in the independent cohort. Statistical significance in change of gene expression: *p < 0.05, **p < 0.01, ***p < 0.001. (c) T2D Interactome signatures targeted by anti-diabetic medications.

