Figure 3.
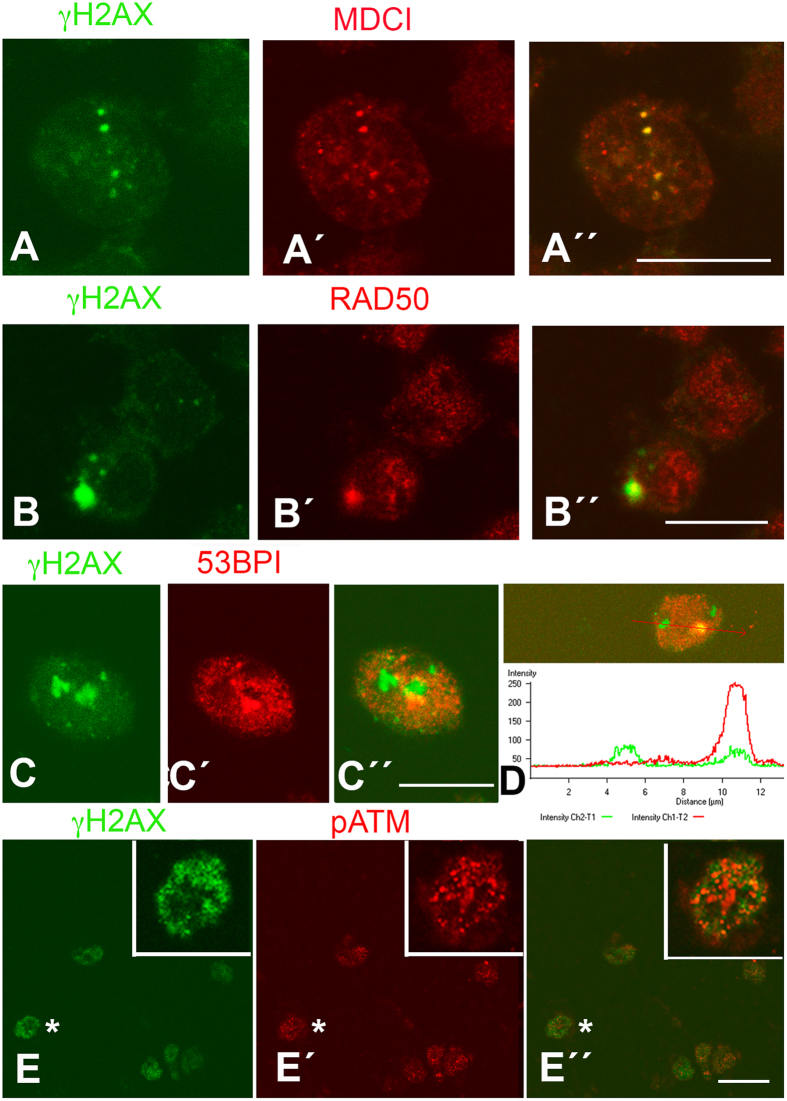
Mouse interdigital cells at day 13.5 pc immunolabeled for γH2AX (A–C) in combination with MDC1 (A´), RAD50 (B´) and 53BP1 (C´) to show the activation of DDR mediators prior to overt cell degeneration. A´´, B´´, and C´´ are merged images. (D) Pixel intensity plot of the region indicated by red arrow showing the labeling distribution of 53BP1 (red) and γH2AX (green) in an interdigital cell similar to that shown in (C) Note the presence of isolated γH2AX foci and a region of colocalization with 53BP1. (E) Chick interdigital cells at id 6 immunolabeled for γH2AX (E) and pATM (E´). E´´ is the merged image. Inset is a detailed view of the cell indicated by asterisk. Bars in (A–C) = 10 μm; bar in (E) = 30 μm.

