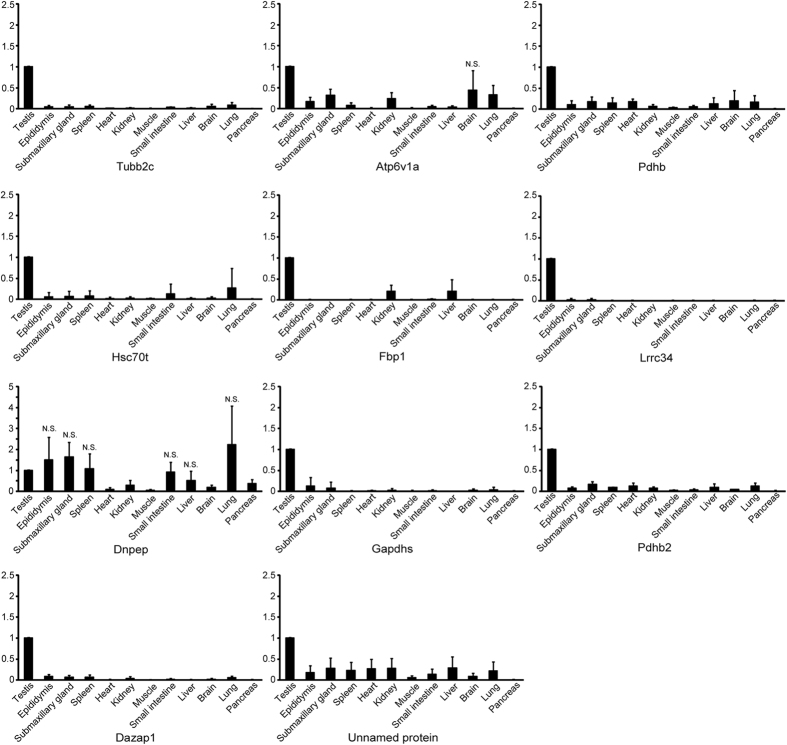
Figure 4. AIs mRNA expression by real-time RT-PCR analysis in various organs.
Relative intensity was calculated, after which the expression in the controls (testis) for each point was normalized to 1. Each bar represents the mean ± SD. Significantly different from the vehicle control, p < 0.05. N.S. represents the non–significant values compared to the testis. The remainders with no N.S. were significantly different compared to the testis (p < 0.05).

