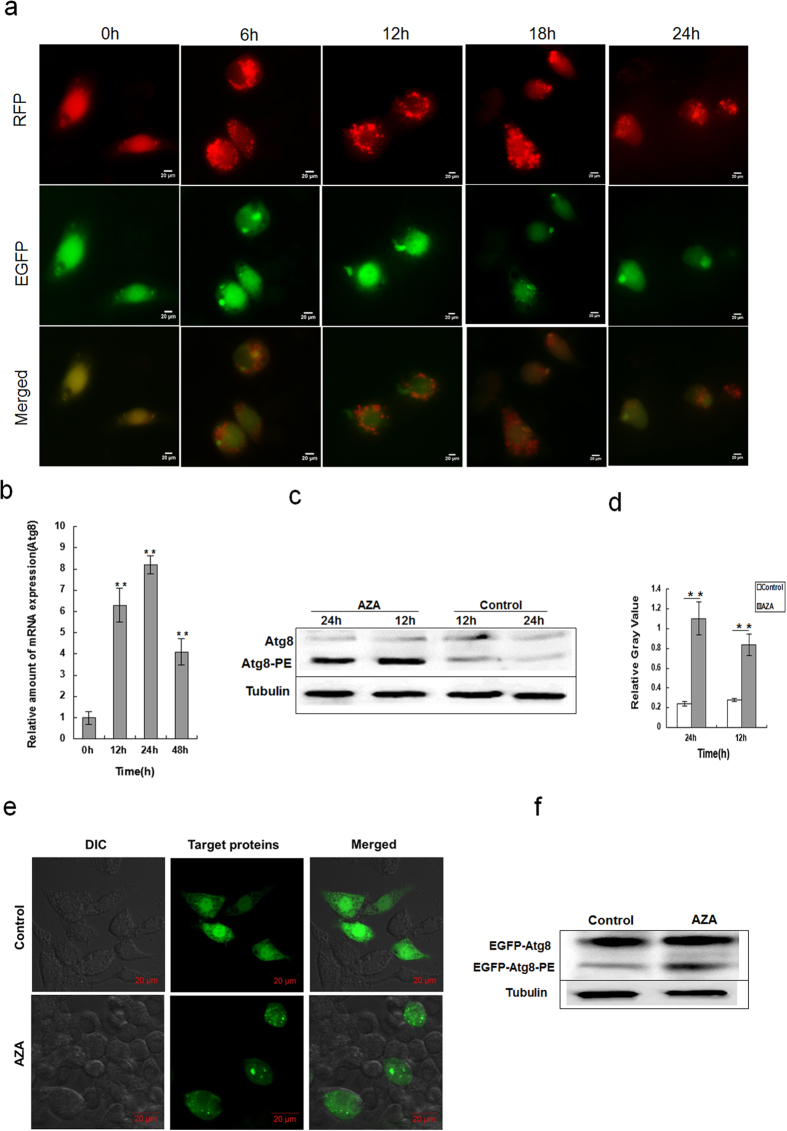
Figure 2. The expression level of Atg8-PE and subcellular distributions in SL-1 cells.
(a) EGFP and RFP puncta represent autophagic vacuoles and display differential pH sensitivity. (b) Cells were induced by AZA, and the relative expression of ATG8 mRNA in different treatments was determined by qRT-PCR. Data are the mean ± S.D. **p < 0.01 compared with 0 h. (c) Western blot of Atg8-PE level induced by AZA in SL-1 cells. Control was without treatment, tubulin was used as a loading control for the western blot analysis. (d) The quantification of Atg8-PE from 3 experiments performed in triplicate. Data are the mean ± SD. **p < 0.01 compared with the control group. (e) pIEX-4-EGFP-Atg8 transfected into SL-1 cells, with AZA treaments for 12 h, and the puncta of EGFP-Atg8-PE conjuncted with the autophagosome. (f) Western blot of EGFP-Atg8-PE by EGFP antibody from EGFP-Atg8-PE over-expressed cells induced by AZA. Control was without treatment.

