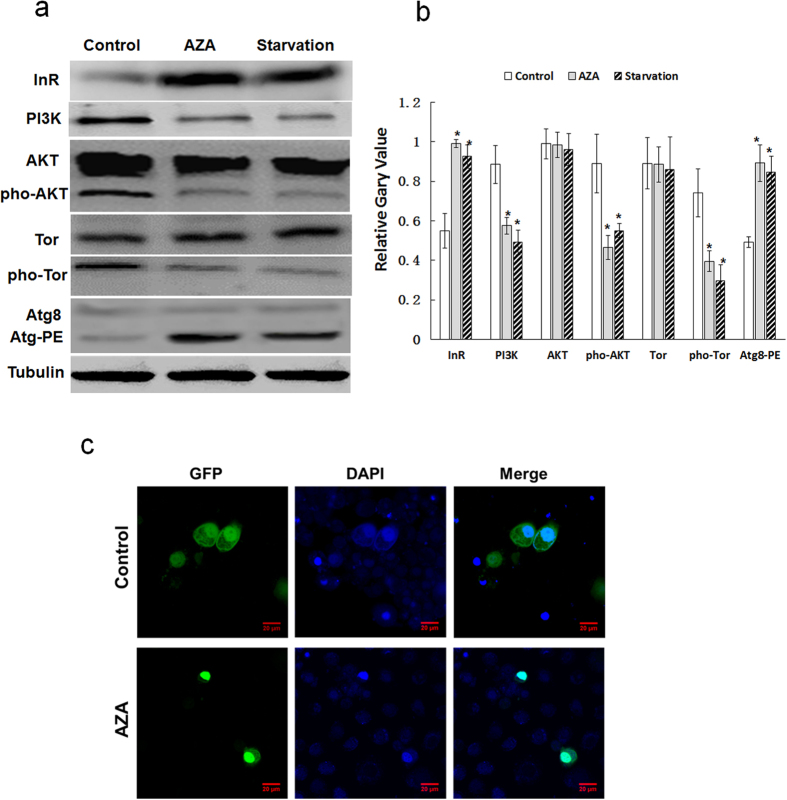
Figure 3. Effects of AZA and starvation treatment on the InR-PI3K-AKT signaling cascade, FOXO and ATG8 in SL-1 cells.
(a) Cells were treated with AZA (2.5 μg/mL) and PBS for 24 h, control was without treatment, tubulin was used as the internal control. (b) The quantitative results from target proteins of three independent experiments. Data are the mean ± S.D. *p < 0.05 compared with control group. (c) pIEX-4-FOXO-GFP transfected into SL-1 cells were treated with AZA for 24 h and stained with DAPI.

