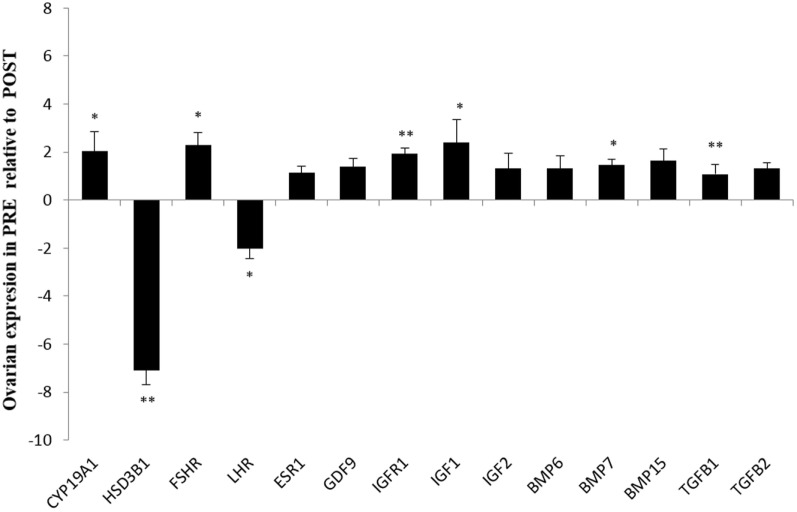
Figure 1.
Relative expression values for each candidate gene in both ovaries from prepubertal (PRE) heifers versus both ovaries from postpubertal (POST) heifers. Relative expression value is expressed as the least square means ± SEM of 2−(Estimate). Bars above the origin mean higher expression in PRE compared to POST. *P < 0.05; **P < 0.01.

