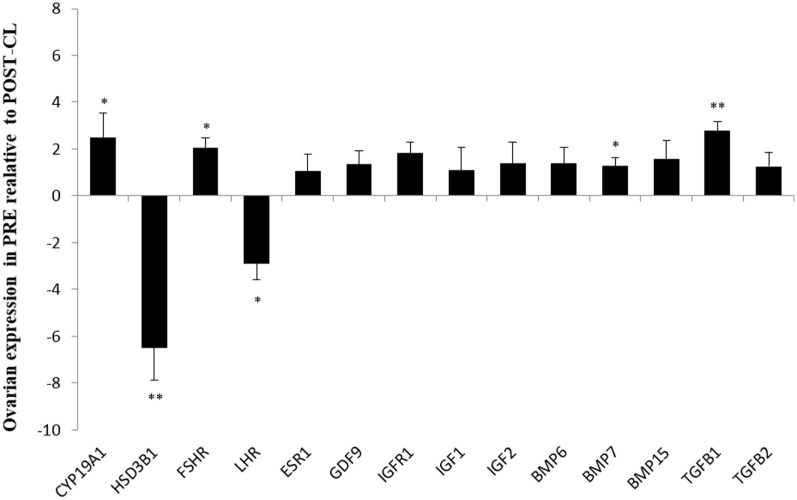
Figure 2.
Relative expression values for each candidate gene in both ovaries from prepubertal (PRE) heifers versus only the ovary with corpus luteum of the postpubertal (POST-CL) heifers. Relative expression value is expressed as the least square means ± SEM of 2−(Estimate). Bars above the origin mean higher expression in PRE compared to POST with CL. *P < 0.05; **P < 0.01.

