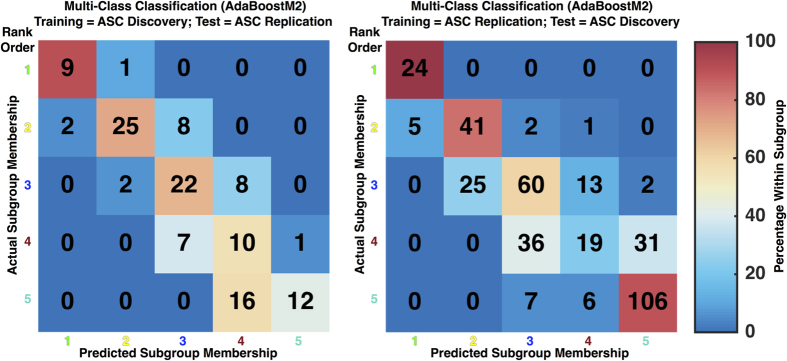
Figure 5. Confusion matrices for multi-class classifier predictions of ASC subgroup membership.
This figure presents confusion matrices showing actual subgroup membership along the rows and predicted subgroup membership by the classifier along the columns. In each cell the numbers refer to counts of the number of individuals in each cell. We also used color in each cell to depict the percentage of actual subgroup individuals predicted within each subgroup category (0% indicated by dark blue, and then color continuously changing to dark red indicating 100%). Above the matrices are descriptions of which dataset was used for training and testing.

