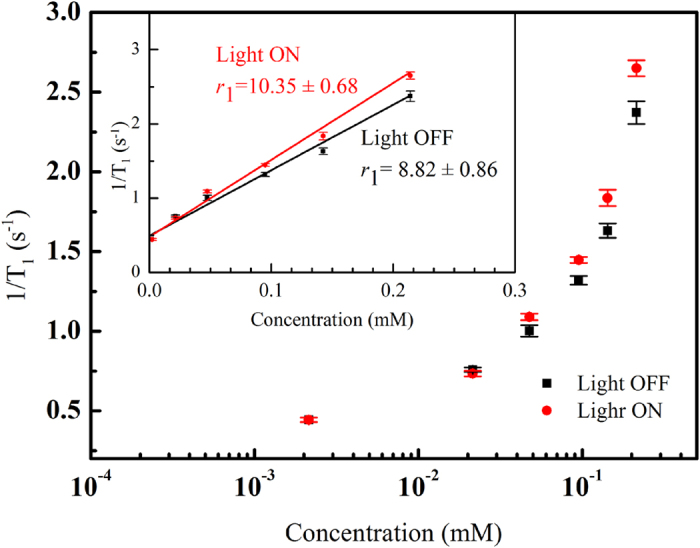
Figure 3. Spin–lattice relaxation rate (1/T1) as a function of iron concentration in a 1 mL aqueous solution of γ-Fe2O3@Au nanoparticles in the presence and absence of light irradiation.

The insert shows the longitudinal relaxivity of the γ-Fe2O3@Au nanoparticles. The values are presented as the mean ± SEM after 10 measurements.
