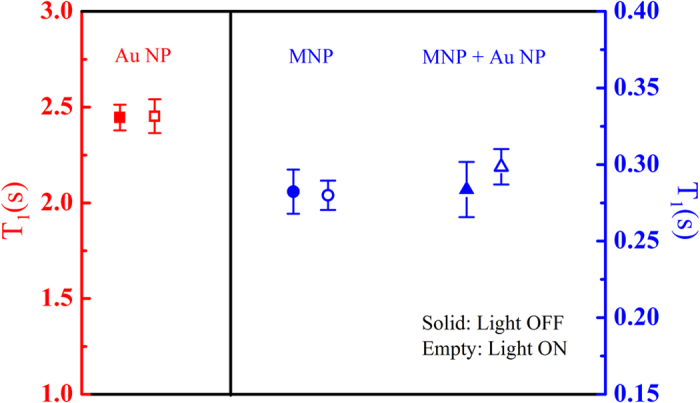
Figure 5. T1 values of the aqueous solutions containing Au nanoparticles (NP), Fe3O4 magnetic nanoparticles (MNP) and a mixture of Au and Fe3O4 MNP in the presence and absence of light irradiation.

The empty and solid symbols represent the data measured in the presence and absence of light irradiation, respectively. The data of Au NPs refer to the left axis, whereas the data of MNPs and the mixture of Au NPs and MNPs are represented in the right axis. These values are also presented as the mean ± SEM after 10 measurements.
